Get started
- Create a new sequence database or open an existing database (see basic functions below)
- Import sequences into your database (see basic functions below)
- Active sequences (check) from all sequence panel
- Then enjoy Librator to analyze, edit and clone your sequences
User Interface
-
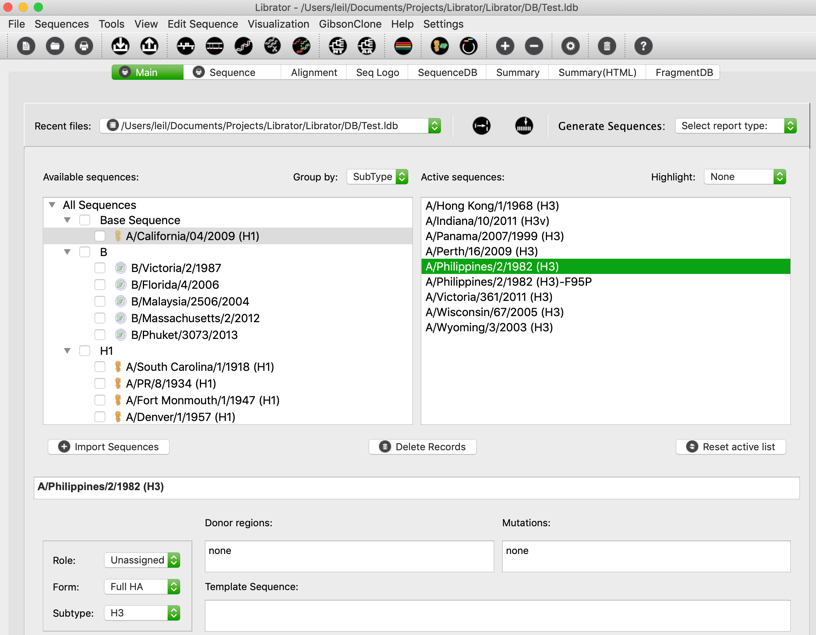
Main Tab
This is the main page of librator. Users are allowed to load existing database, browse, active, edit and manage their sequences. Users can check records in the “Available sequence” panel to active them. Users are also allowed to inactive a sequence by double click it in “Active sequences” panel or uncheck it in the “Available sequence” panel. Users should set a “base sequence” for the database. It unique and changeable. It is the current target/template of most operations.

-
Sequence Tab
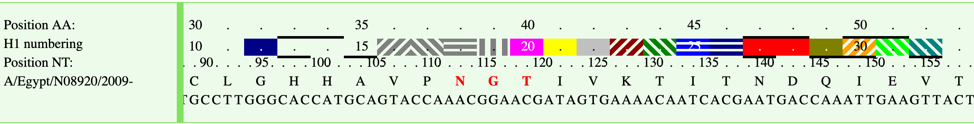
This page shows HA numbering details of current selected sequence. Mutation info, antigenic sites and donor region info will be displayed in the sequence viewer.

-
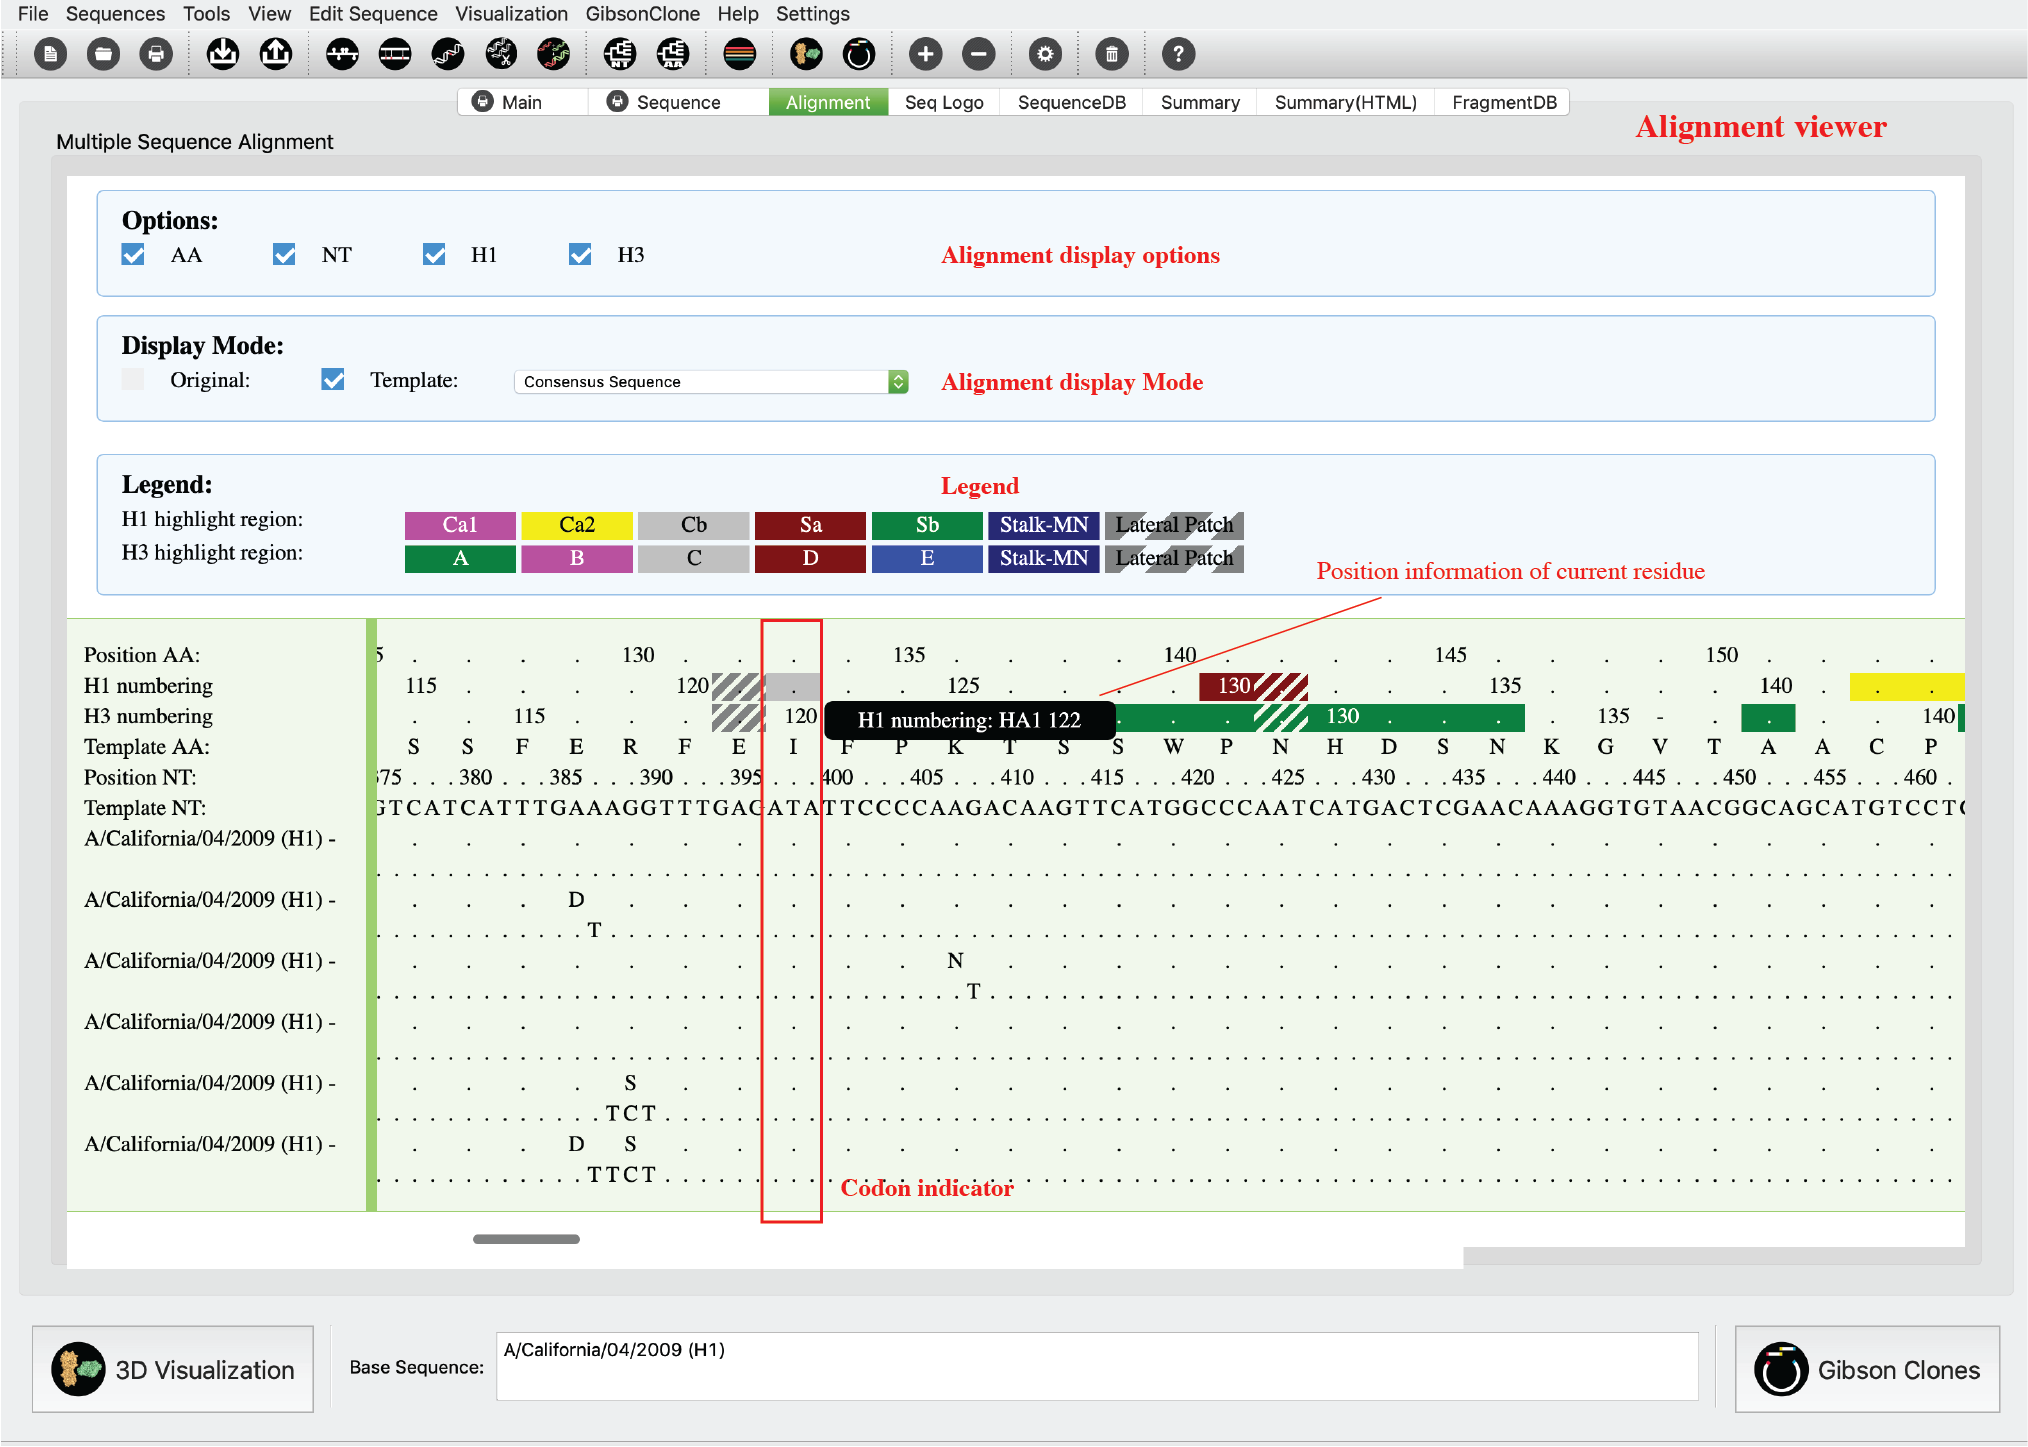
Alignment Tab (HTML)
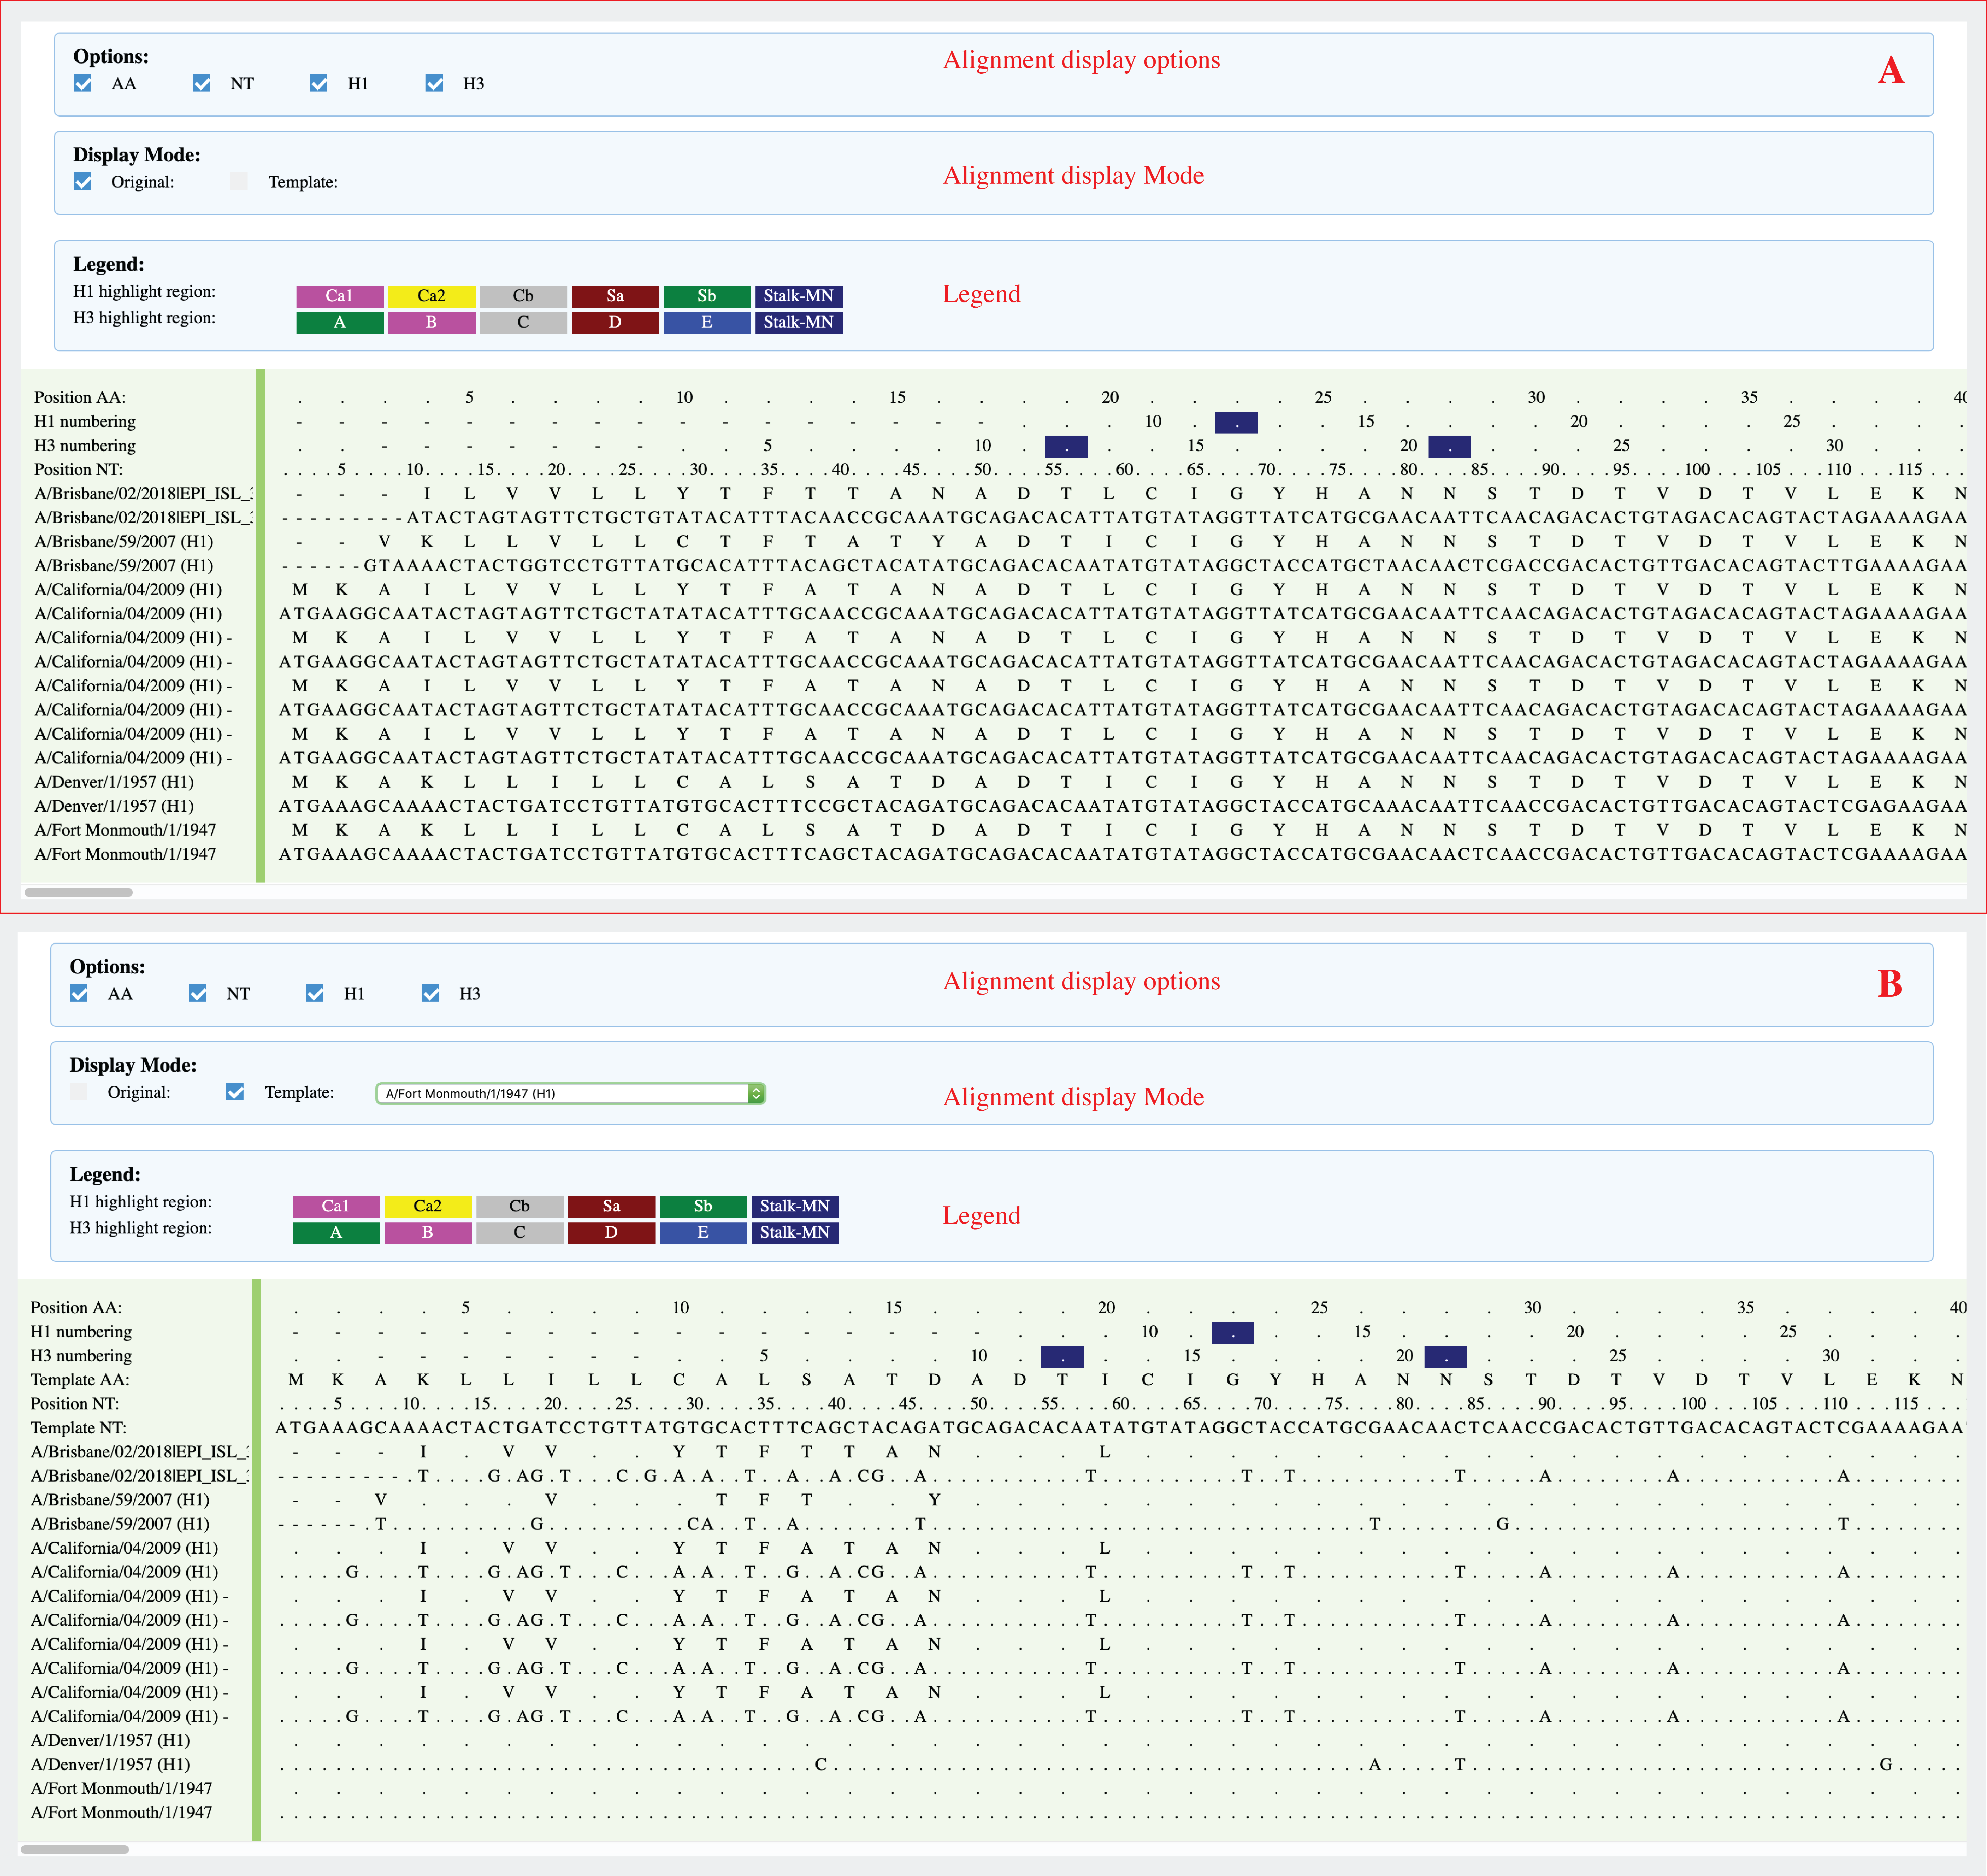
This sequence alignment viewer shows the multiple sequence alignment (MSA) for selected sequences (It also works for one sequence). There are two display modes: original mode shows all nucleotides and peptides; template mode will only highlight sequence differences. A red rectangle indicates current focus residue (mouse position) and will automatically display HA numbering information of current residue.
-
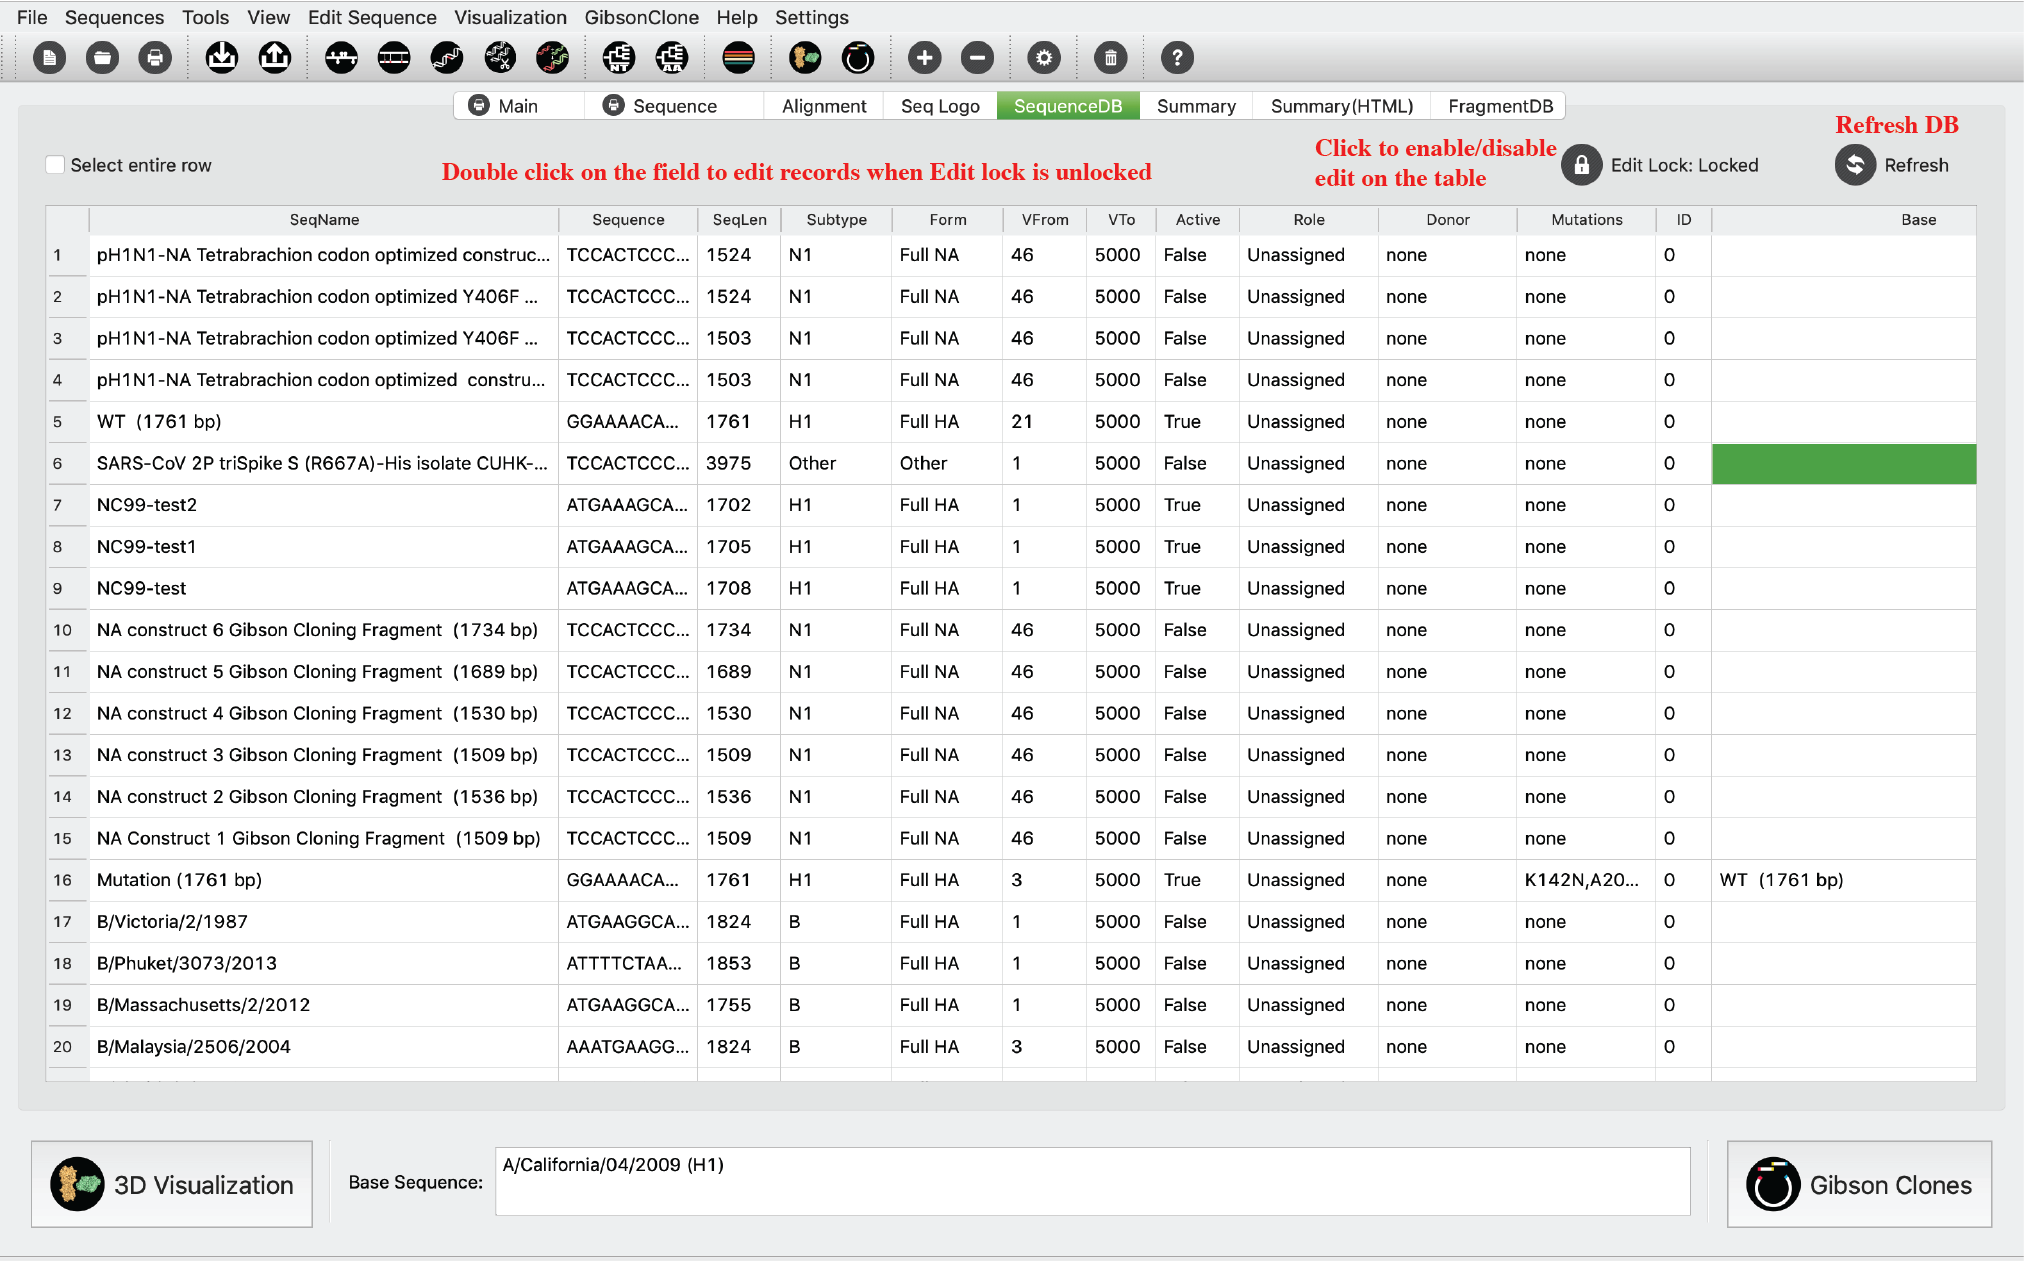
Sequence DB Tab
This tab shows all sequence in current database in a table viewer. Users can enable information edit in this viewer by click the Edit lock. Then users can double click any cell to update the information. Please only edit it when you know what you’re doing. Otherwise it will cause errors or crashes.
-
Sequence Logo Tab
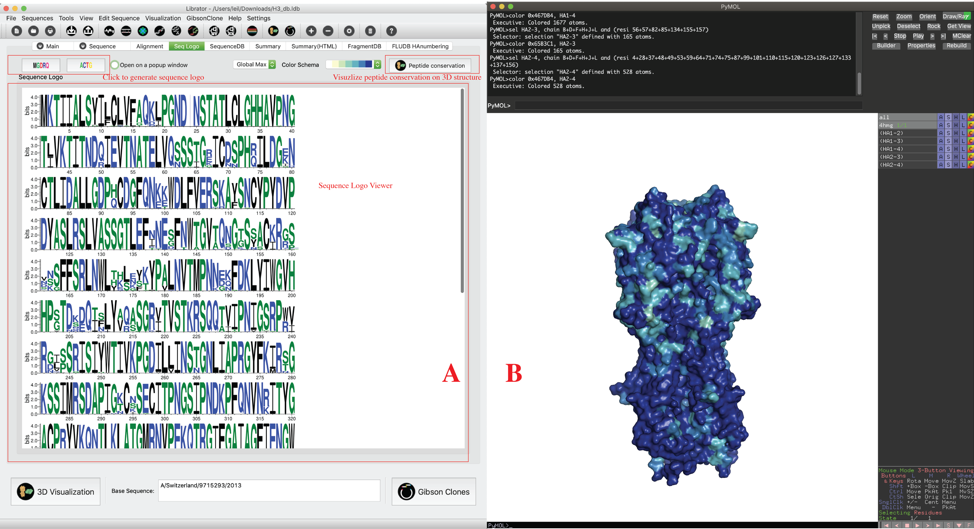
In this tab, we integrated “Sequence Logo” (http://weblogo.threeplusone.com/) to calculate and visualize sequence conservation. Users are allowed to calculate either peptide conservation and nucleotide conservation for their selected sequences. Users are also allowed to visualize the peptide conservation of their selected sequences on a 3D HA structure. Users can choose preferred color schema, then click “Peptide conservation” button. This function is only available for HA sequence for now. If you didn’t install GhostScript and Pdf2svg, the sequence logo will be displayed in a popped-up window.

-
Summary Tab
These two tabs show a summary of current database. Notably, the bottom Amino Acid variation STAT is based on all historical H1, H3 and NA sequences (not sequences in current database).

-
Summary Tab (HTML)
These two tabs show a summary of current database. Notably, the bottom Amino Acid variation STAT is based on all historical H1, H3 and NA sequences (not sequences in current database).

-
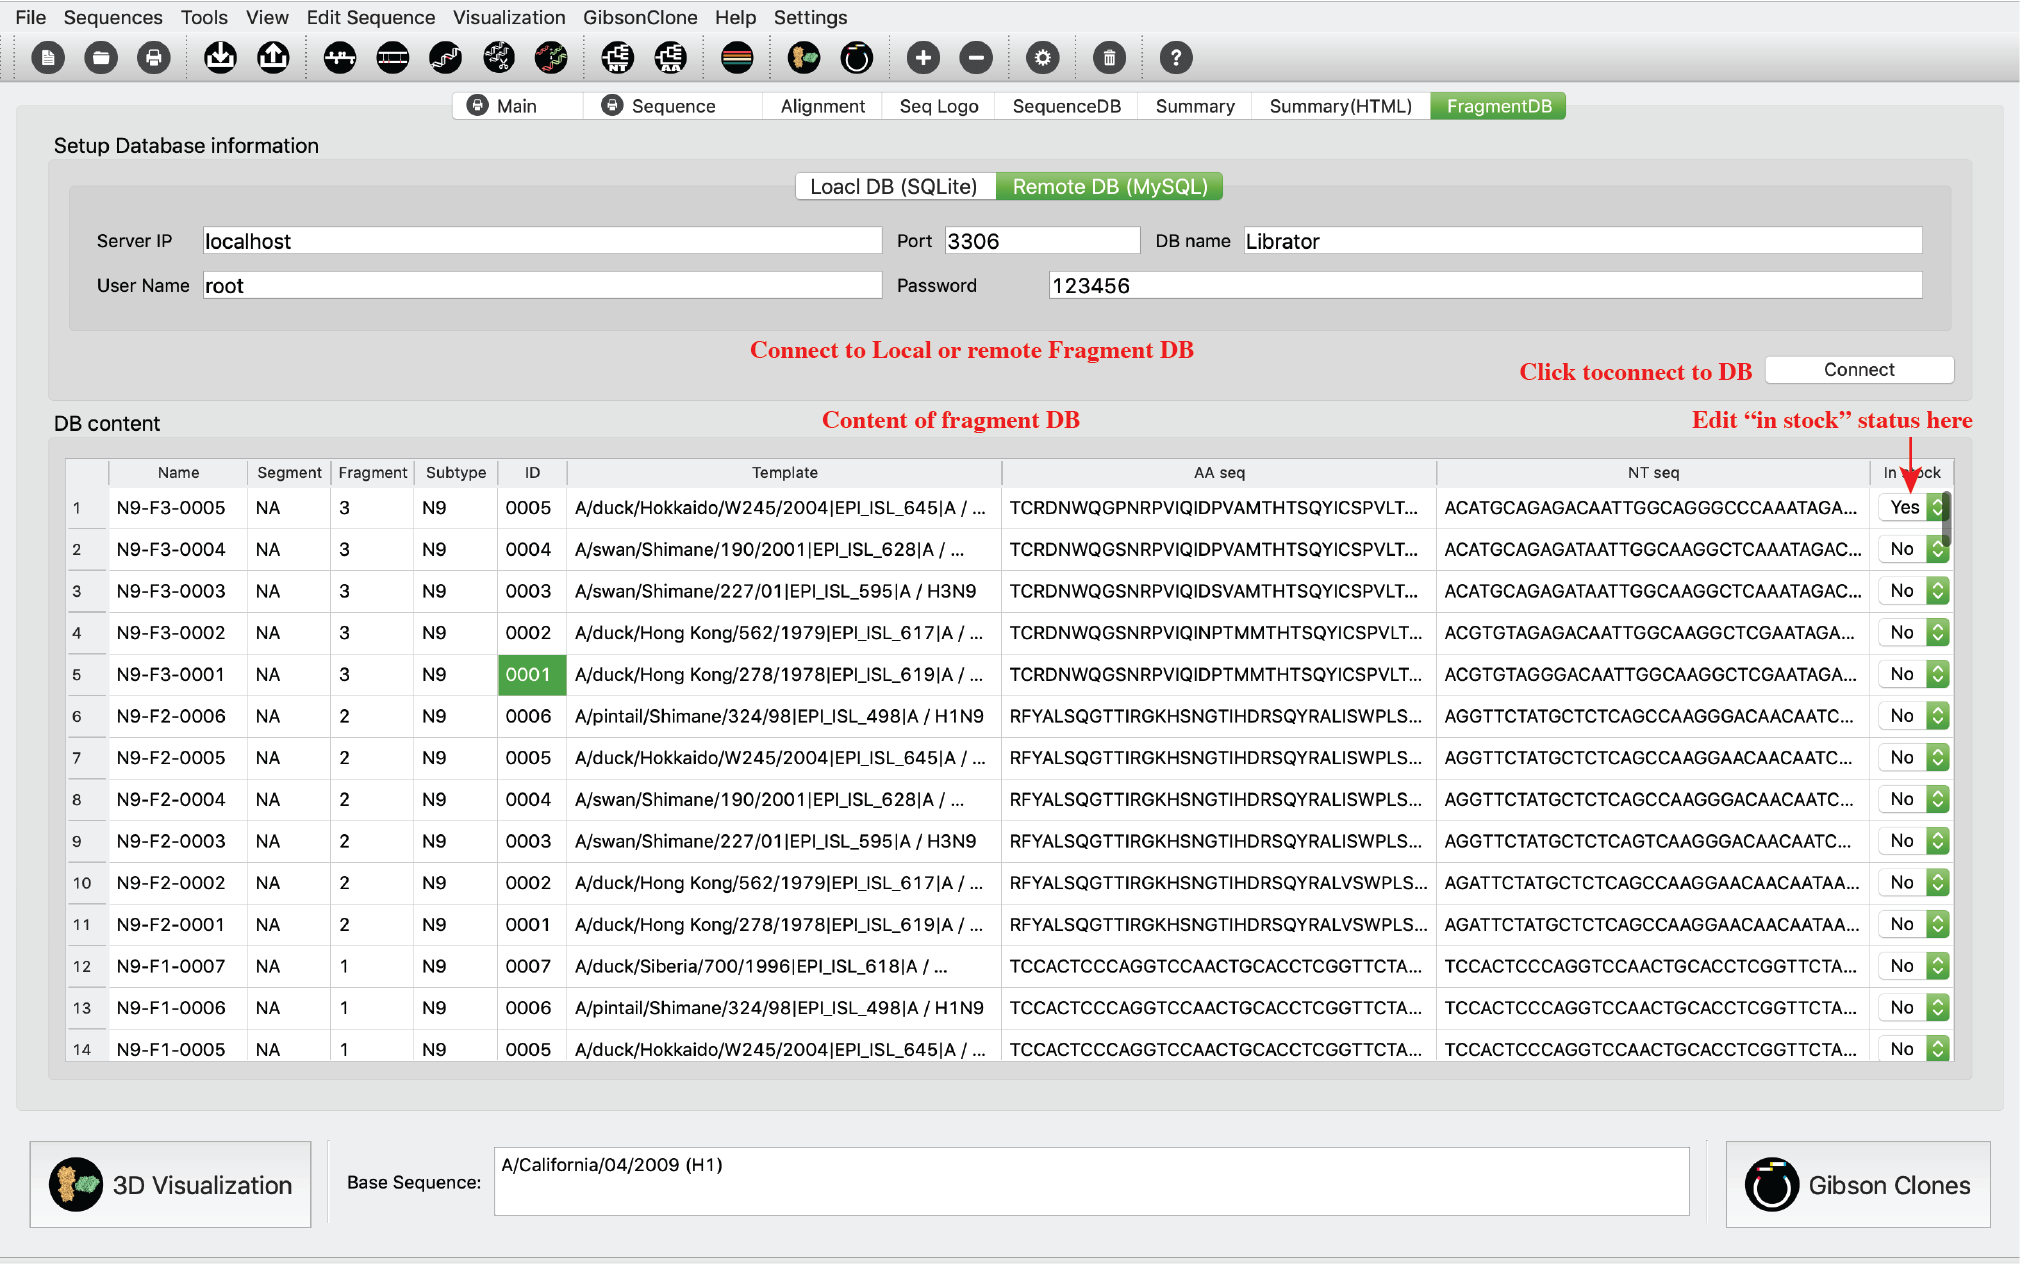
Fragment DB Tab
This tab was designed for Lab managers to manage their lab reagent stock. Users are allowed to connect to a local database or a remote MySQL database. When ordered sequences/fragments arrived, they can just change its “In stock” status to “Yes”, and vice versa.
-
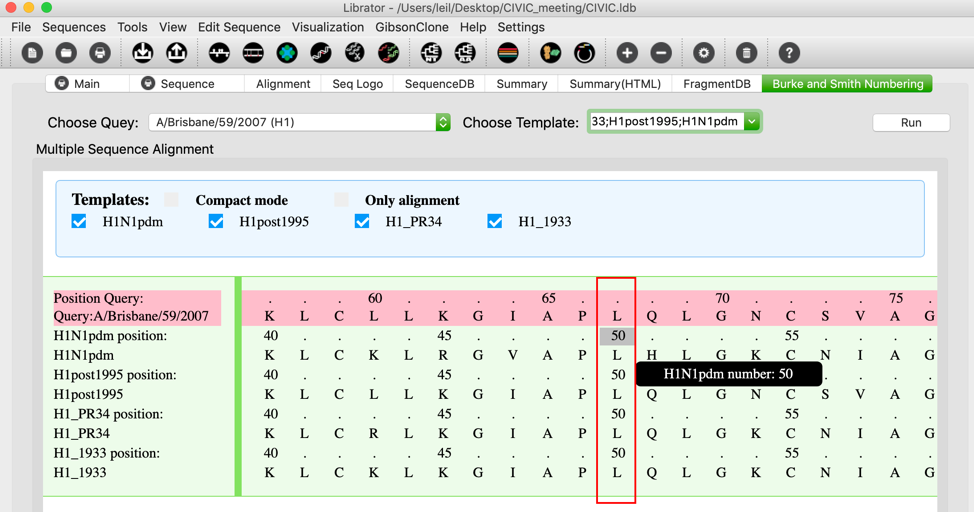
Burke and Smith HA numbering Tab
Beside structure-based H1/H3 numbering system utilized in Librator, there is another HA numbering system in this field. This HA numbering scheme was proposed by Burke and Smith in 2004 and has been implemented by FLU DB recently. This numbering system aligns query sequence against a few template sequences and then assign position number of residues according to the alignment. This tab was designed for Burke and Smith HA numbering scheme. Users are allowed to align a query sequence to multiple template sequences of different HA subtypes to determine residue numbers.
Functions
Basic functions
-
Path setting
Users can set paths for all required tools and databases. Click Setting-> Preferences in menu. You can type path or click Browse button to choose the correct path. You also can determine the default tool for 3D structure visualization.

-
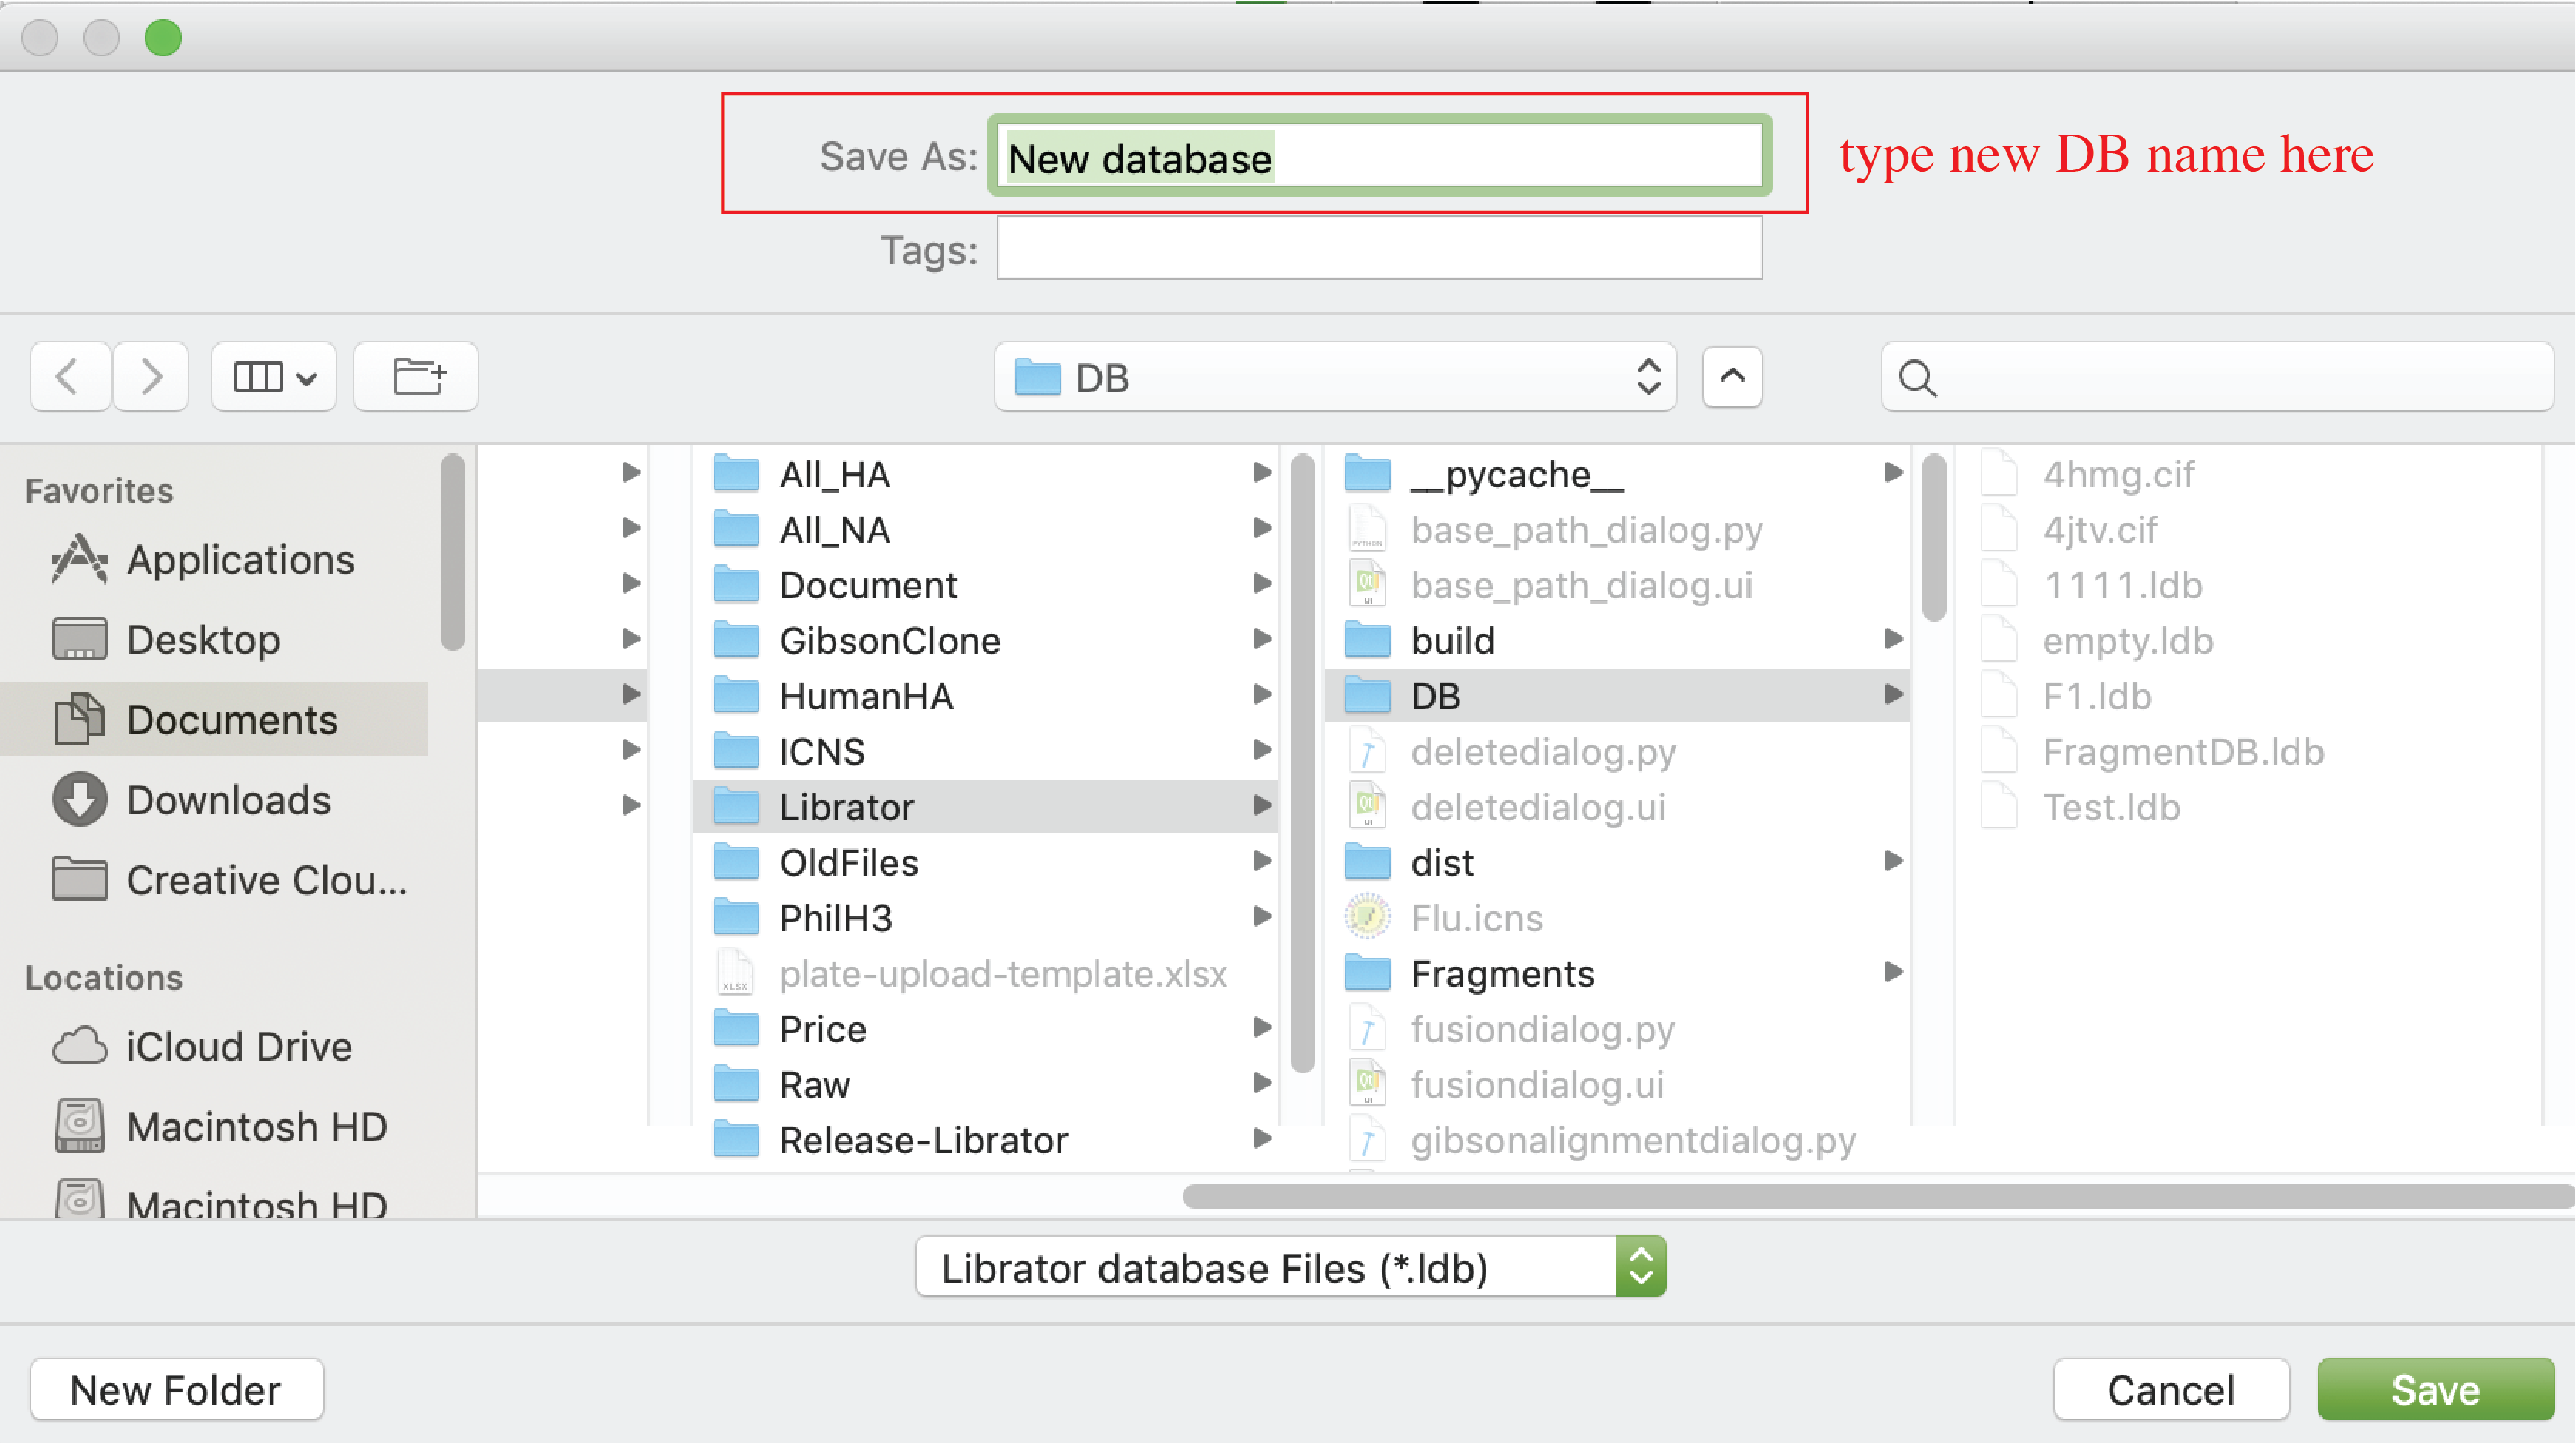
Create new sequence database
Users can create new sequence database. Click File-> New in menu
-
Open existing sequence database
Users can create new sequence database. Click File-> Open in menu

-
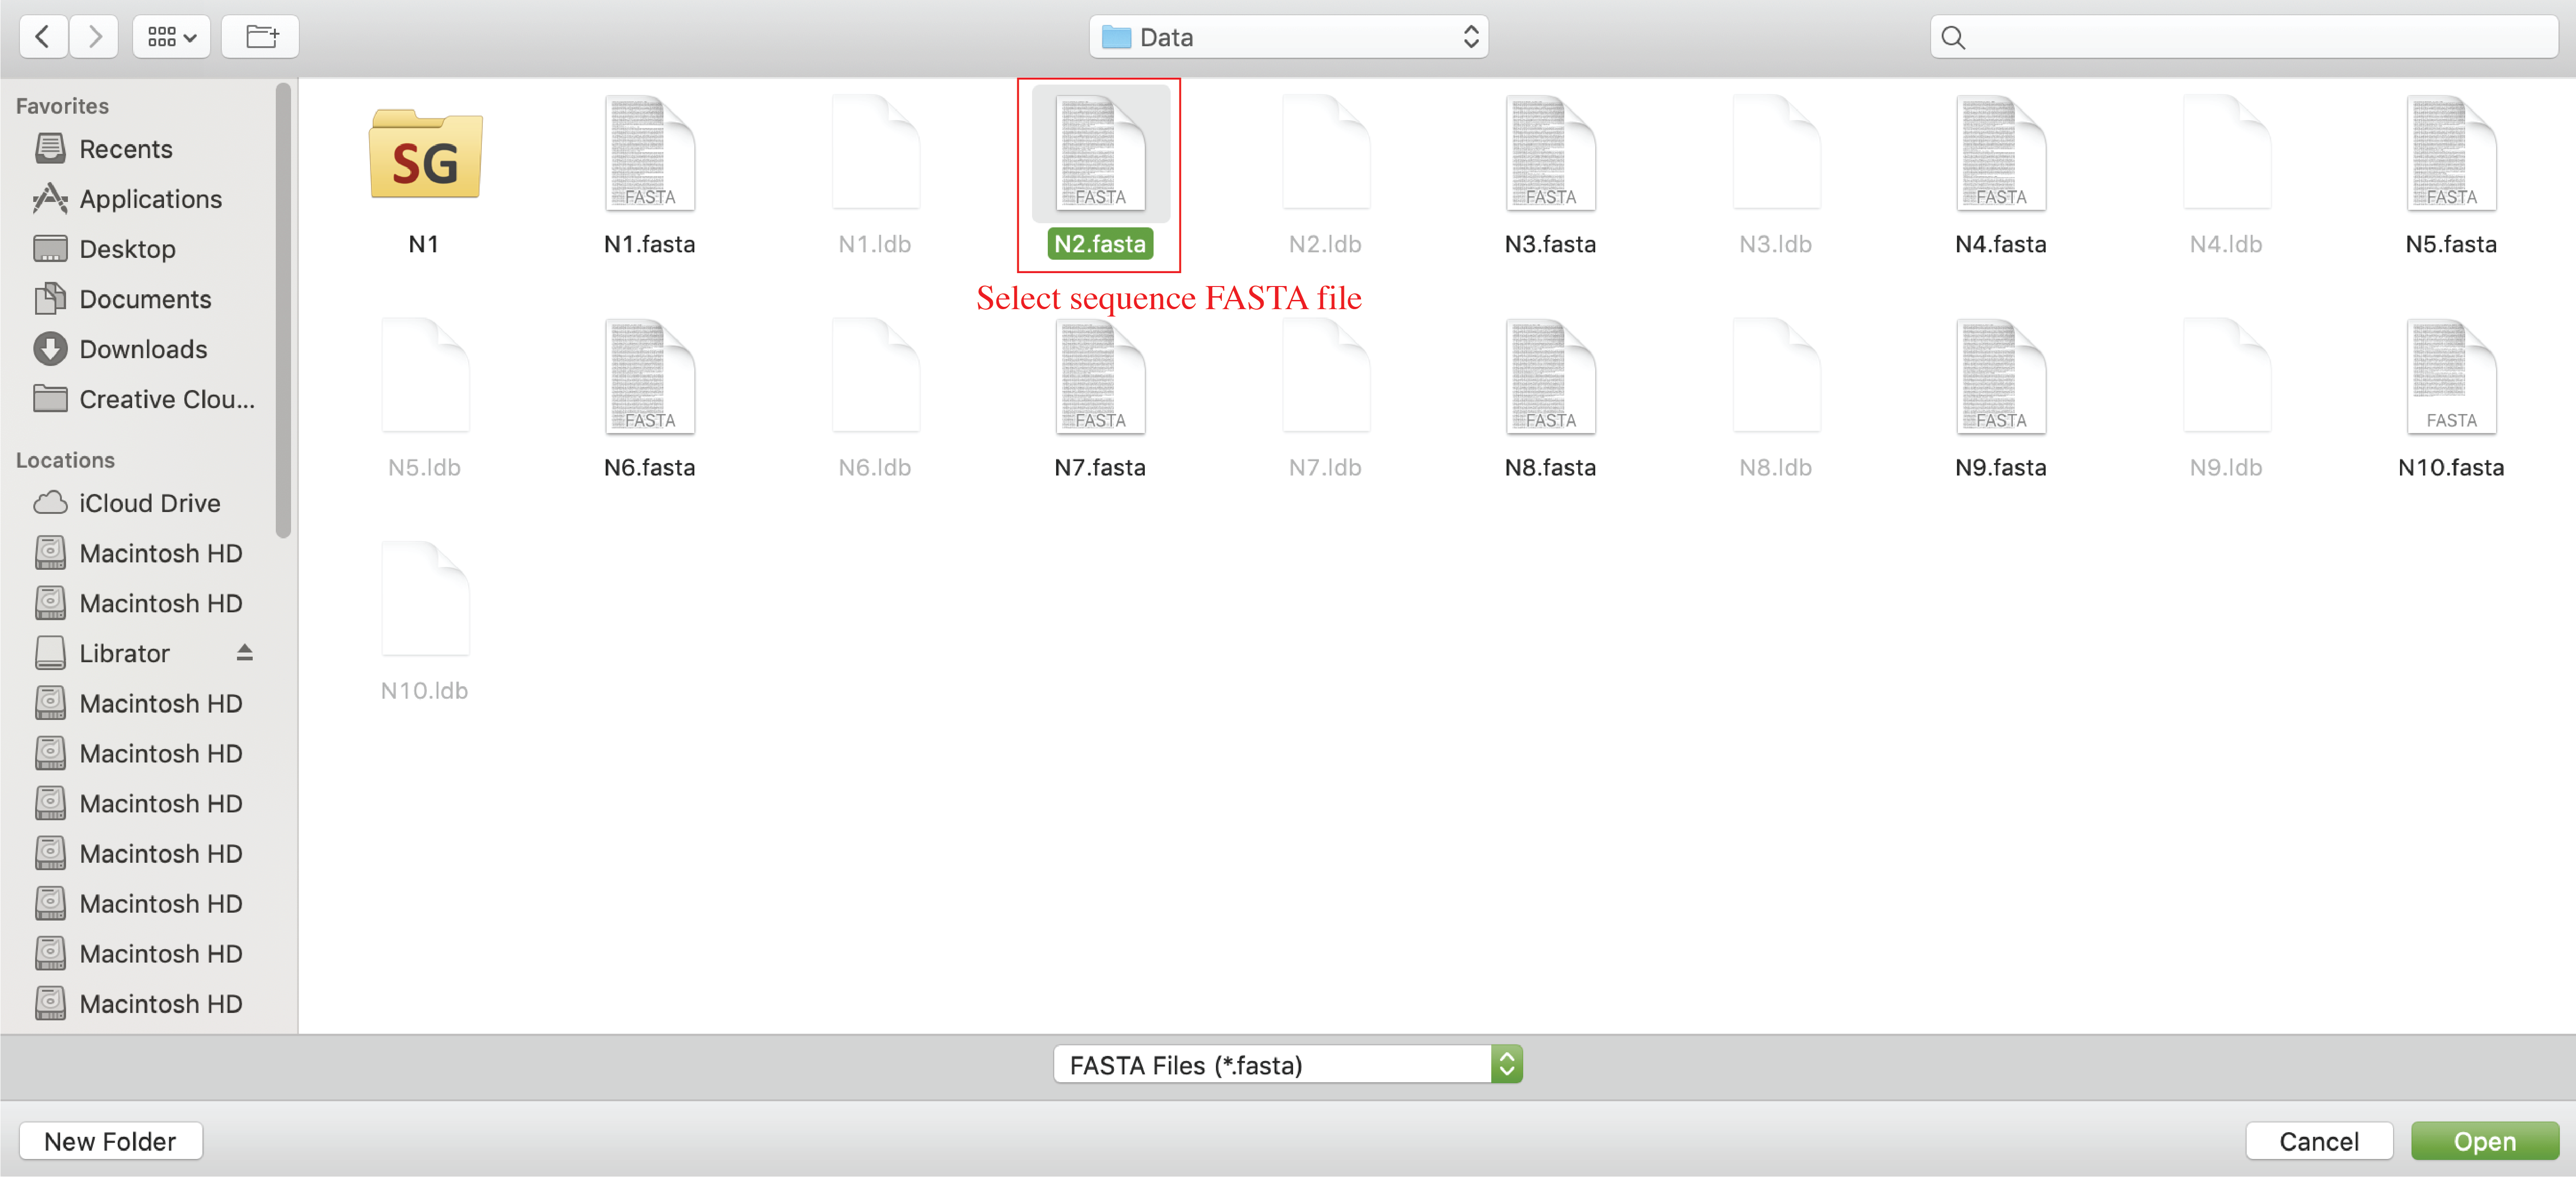
Import sequences
After load an existing sequence database, users can import sequence into current database. The input files should be in FASTA format. Click Sequences-> Import in menu
-
Export sequences
After load an existing sequence database, users can import sequence into current database. Selected sequences will be exported to a FASTA file. Click Sequences-> Export in menu

Advanced functions
1) Sequence analysis
-
Edit information of sequences (on Main tab)
Users can edit information (sequence name, Role, Form, Subtype, NT sequence, reading frame, donor regions) of sequences on main tab.
For Sequence name, users can click sequence name text input to edit it.

For Role, Form, and Subtype, users can edit by the left panel. Users can select multiple sequences in active sequence panel to do bulk update.
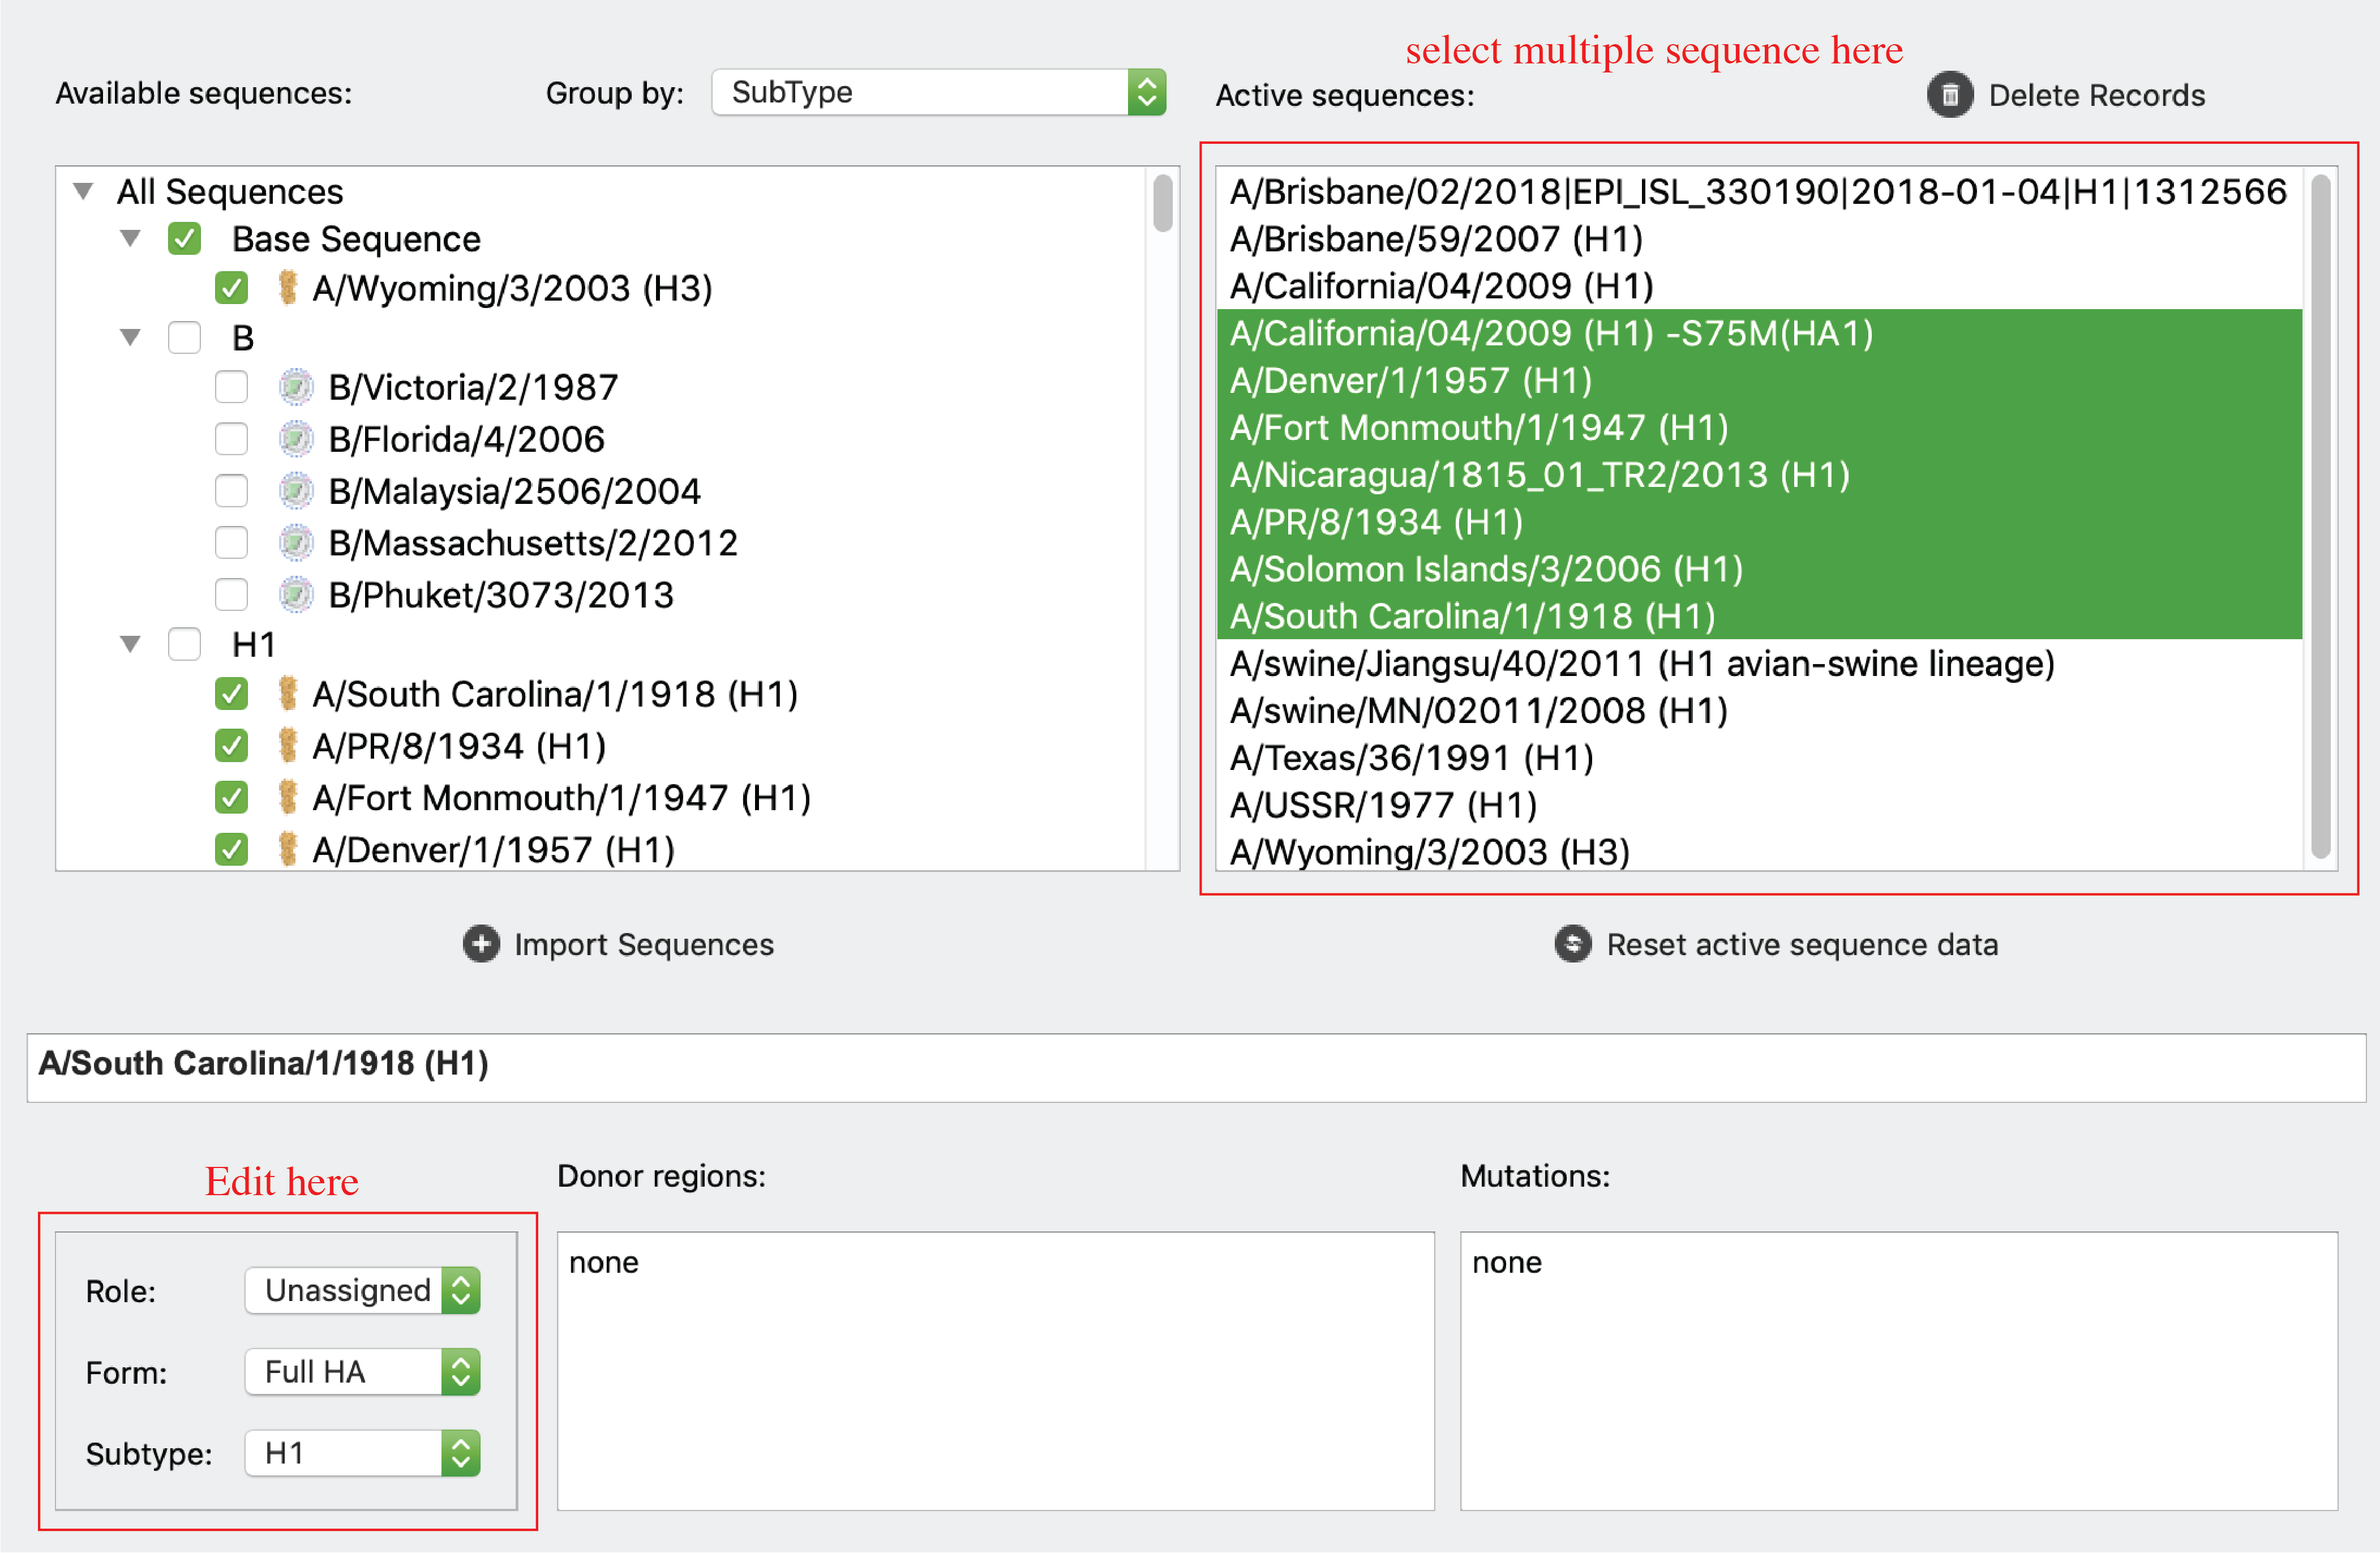
For reading frame start and end, users can use the “Coding region” inputs. For NT sequences, users can click “edit sequence” button to edit sequences.

Note: coding region and NT sequence editing is disabled for sequences with mutation information. For donor regions information, users can click “Donor region” input to update information.
-
HA numbering system
Users are allowed to access H1/H3 numbering of selected sequence in two ways:
1) Please select your sequence on active sequence panel and then click Tools-> HA Numbering in menu, or just click “Sequence” tab. Please see “Sequence” Tab for interface and details.
2) Please select your sequence on active sequence panel and then click “Alignment” tab. This interface is interactive, please mouse over your interested residues for more details. A red rectangle will always indicate your current focus. On the H1/H3 numbering ruler, antibody binding sites (ABS), receptor binding sites (RBS) are highlighted by different colors and patterns.

-
HA epitopes customization
We also allow users to customize their epitope settings. Users can setup their epitope settings by clicking Settings -> User defined epitopes.
There are two tabs on the UI, users are allowed to modify current annotation groups or current annotation of each residue.
There is a combo box for users to switch between H1 and H3 numbering. Users are allowed to pick different colors, shades and borders for their own groups. For example, colors for multiple antigen binding sites (e.g. ABS-A,B,C,D,E), shades for epitopes adopted from literature (e.g. lateral patch), borders for receptor binding sites (e.g. 130loop, 150loop, 190 helix…).
There is also an option for users to restore default settings for H1 or H3. As shown in the following figure, we pre-defined 13 distinct colors, 4 shade patterns and 3 border styles for users to define their own epitopes. Different colors, shade patterns and borders can be superimposed to denote residues in multiple epitope groups.

After setup their own epitopes, users are allowed to annotate each residue using different color groups, shade groups and border groups. As shown in the following figure, users can determine each individual residue into different color groups, shade groups and border groups by simply clicking the combo box. The graphic icons in combo box help users to easily recognize different epitopes and their current settings.

After correctly setup your own epitopes, you can easily visualize those epitopes on sequence viewer.
-
Multiple sequence alignment
Users can align multiple sequences together and check the results in a graphical viewer. Click Tools-> Multiple Alignment(HTML) in menu. There are two display modes: original sequence mode and template mode. In template mode, users can choose any sequence (including consensus sequence) as template to only highlight sequence difference.
-
Export alignment to PNG files
Users are allowed to export their alignment to a long PNG file in “Alignment” tab or the popped-up MSA window.

When the alignment is fully loaded, users are allowed to click “Save Img” button to export their alignment to PNG files. Of note, converting alignment to PNG figures usually takes 10-30 seconds, so please be patient and wait for the pop-up window to choose where you want to save your PNGs. After PNG figures were saved, you can go to the folder to check the results. There will be three PNG files, they are figure legend, alignment header (sequence names) and alignment body (a very long figure).

Here is an example of exported PNG:
legend

Alignment header

Alignment body

-
Generate phylogenetic tree (ML tree)
Users can generate sequence logo for multiple selected sequences. Users should select multiple sequence in main page, then click “Seq logo” tab. On “Seq logo” tab, users can click Peptide logo or Nucleotide logo to generate sequences logos (Panel A). Users also can check the checkbox called “open Sequence logo on a popup window” to view the sequence logo on a popup window and then can be saved as an EPS file (vector graph) for further use. Users also can click the button on the right top corner to visualize peptide conservations for selected sequences on a 3D structure using PyMOL (panel B) or UCSF Chimera (Figure not shown). The structure annotation code will also be displayed in a pop-up window.


-
Generate sequence Logo (peptide/nucleotide conservation)
Users can generate phylogenetic tree (Maximum Likelihood tree) for selected sequences. Nucleotide and Amino Acid trees are available. For Nucleotide tree: Click Tools-> Generate Maximum Likelihood Tree (nucleotide) in menu; For Amino acid tree: Click Tools-> Generate Maximum Likelihood Tree (Amino Acid) in menu.
Of note, for better visualization, we provide two options for peptide conservation on 3D structure: “Global Max” and “Local Max”. We quantify the amino acid variations by an amino acid variation entropy function (Crooks GE. et al, Genome Research, 14:1188-1190, 2004).
In this peptide variations index, the min value is 0, indicates lowest variation, and the max value is 4.32, indicates highest variation. However, 4.32 is just theoretic max value and is not reachable in practices. For some datasets, using the theoretic max (4.32) will fail to emphasize the difference among all residues. Here, we proposed two schemes: “Global Max” and “Local Max”. In “Global Max” mode, all values will be normalized into [0,1] by dividing 4.32. In “Local Max” mode, all values will be normalized into [0,1] by dividing its own max values. The following figure shows the difference between the two modes. Of note, two models generated under “Local Max” mode is usually not comparable to each other because they used different max value to normalize their entropy values. But, “Local Max” mode usually can improve the visualization results.

-
3D visualization via PyMOL or UCSF Chimera
Users can see 3D structure of selected sequence via PyMOL or UCSF Chimera (only for HA). Click 3D Visualization on main interface.
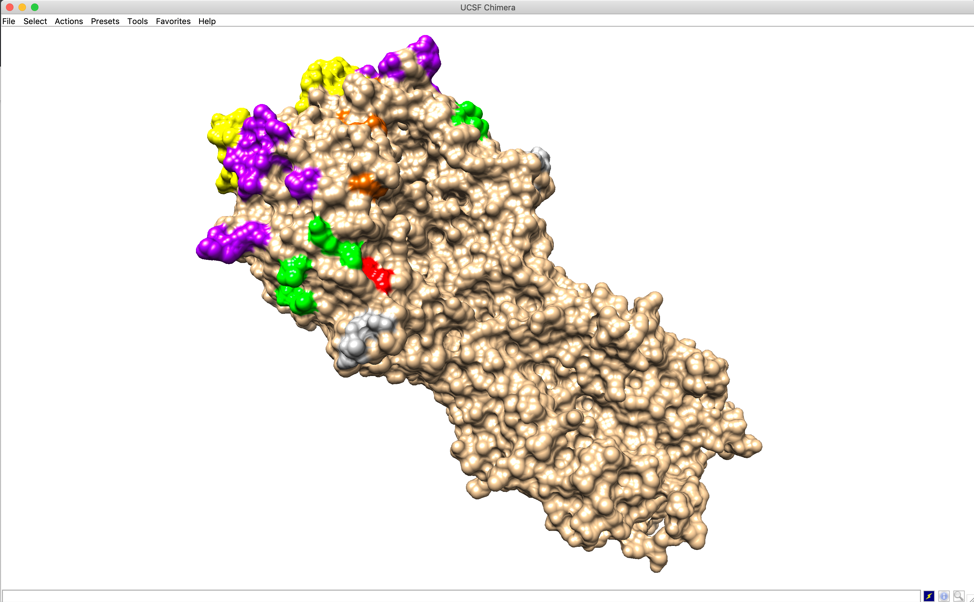
We visualize user defined epitopes on 3D structure. Of note, only epitopes in color group will be highlighted by their pre-defined colors on 3D structure (e.g. antibody binding sites A, B, C, D, E in the figure). Epitopes in shade group (e.g. Lateral patch in the figure) or border group (e.g. RBS in the figure) will be defined in 3D structure but not colored. Users can color those residues manually.
-
Identify possible key residues from two groups of sequences
Librator allows users to identify possible key residues from two groups of sequences. This function could be helpful in the case of identifying key residues that potentially responsible for antigenic change or antibody binding.
Users can click Tools-> Identify key residues in menu. Users can double click sequence names on the left panel to add them into positive group or negative group to the right. Users can click the corresponding arrow to change the destination (green arrow indicates current destination). Users also can double click sequences on the right panel to remove them from current panel. After that, users can click ‘Identify possible key residues’ button to run analysis. The importance of residues is quantified and ranked by numerical score, which indicates the difference of amino acid composition between two groups. All residues will be listed in a table and be sorted by the score (inverse order). Multiple sequence aliment will also be popped up for users to investigate the details.

-
Burke and Smith HA numbering
Users can generate sequence logo for multiple selected sequences. Users should select multiple sequence in main page, then click “Seq logo” tab. On “Seq logo” tab, users can click Peptide logo or Nucleotide logo to generate sequences logos (Panel A). Users also can check the checkbox called “open Sequence logo on a popup window” to view the sequence logo on a popup window and then can be saved as an EPS file (vector graph) for further use. Users also can click the button on the right top corner to visualize peptide conservations for selected sequences on a 3D structure using PyMOL (panel B) or UCSF Chimera (Figure not shown). The structure annotation code will also be displayed in a pop-up window.
2) Sequence editing
-
Mutate sequence
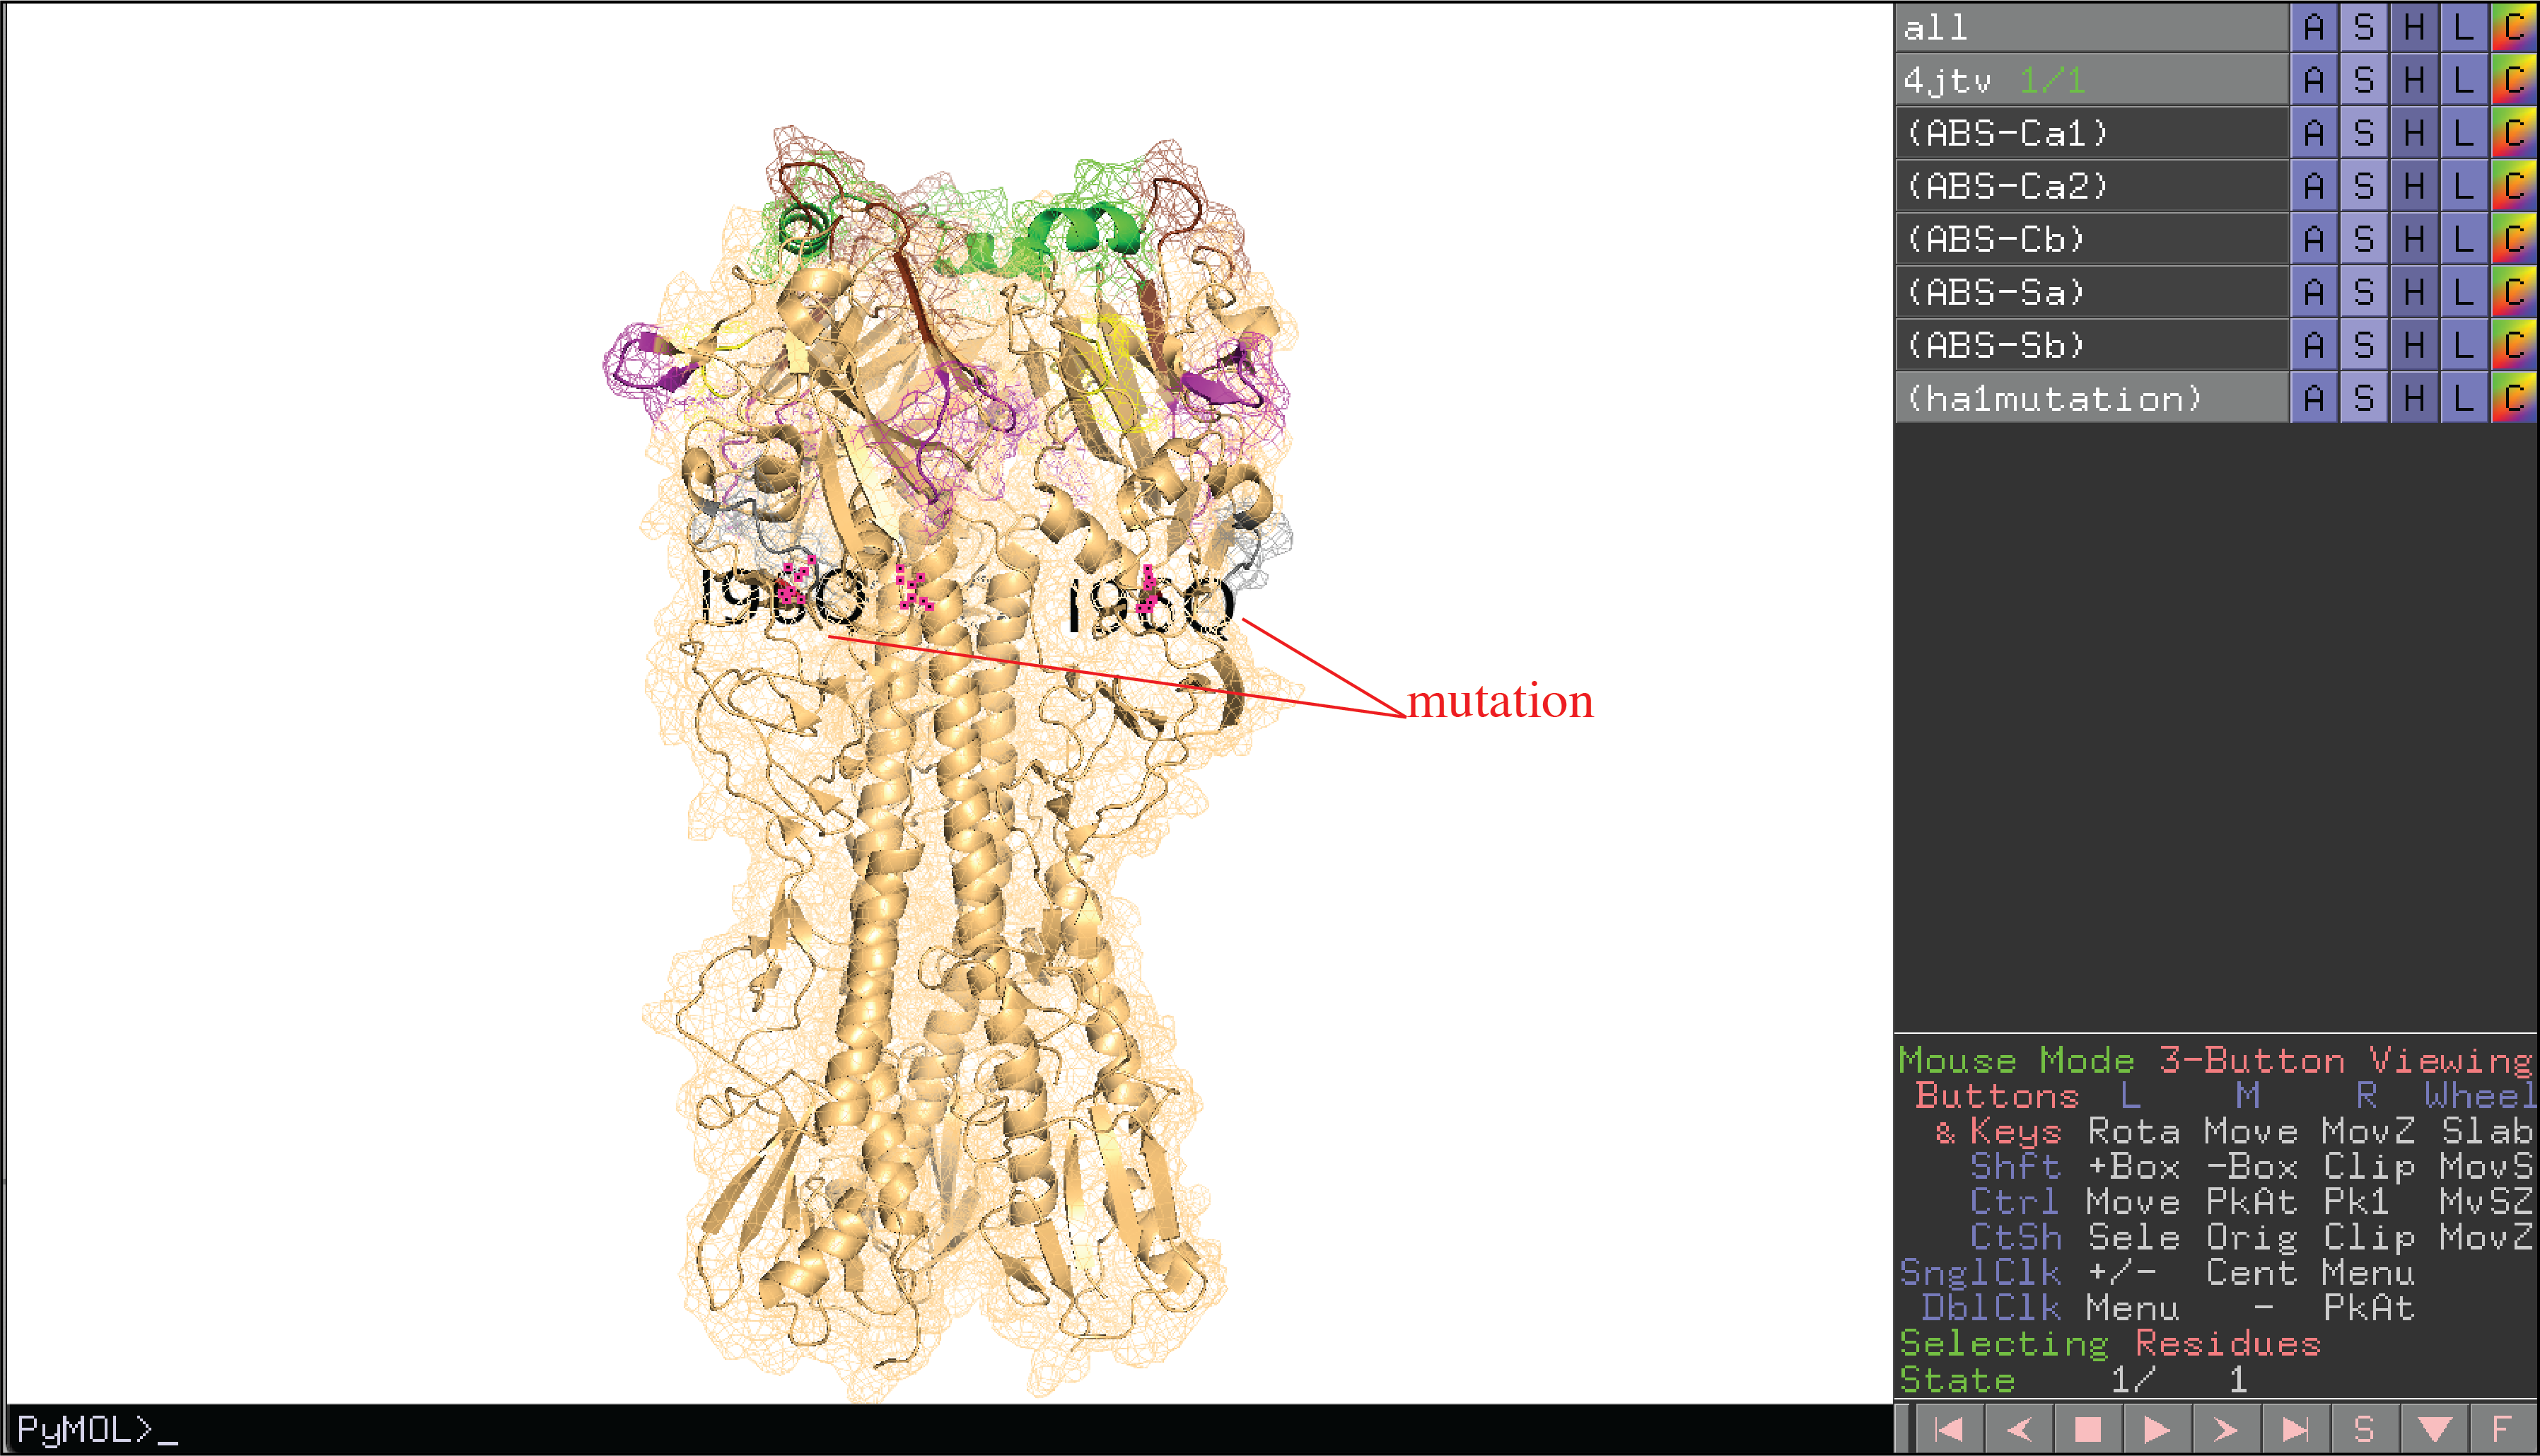
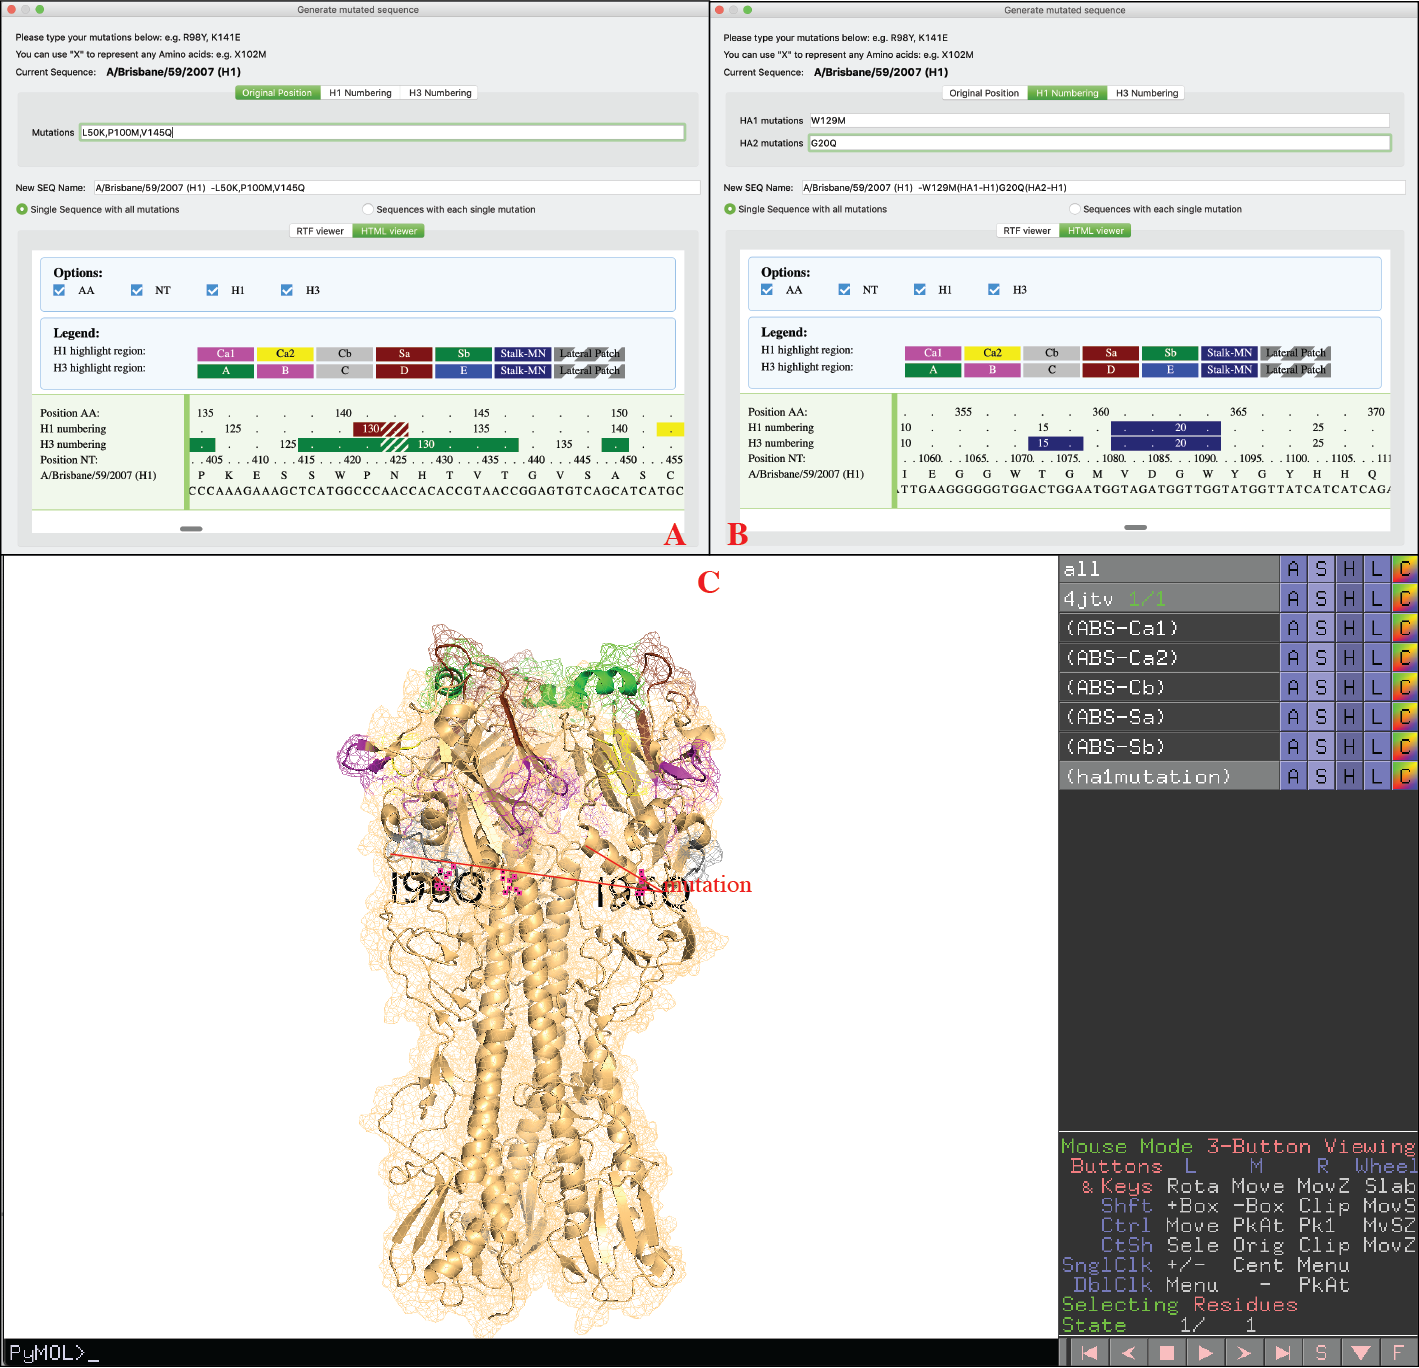
Users can generated new sequences with mutations based on any existing sequence. Click Edit Sequence-> Mutation in menu. As shown below, users can generate mutations on a template sequence using either original position (count from first amino acid, panel A) or H1/H3 numbering (H1 numbering for group1 virus and H3 numbering for group2 virus, panel B). H1/H3 numbering function is only enabled for HA sequences of FLU A. Users are allowed to input multiple mutations at the same time, and are allowed to decide from two options: 1) generate one sequence with all mutations; 2) generate multiple sequences, each of them with a single mutation. After the mutated sequence was generated, users can visualize the 3D structure (only enabled for HA now) of generated HA protein (panel C).
-
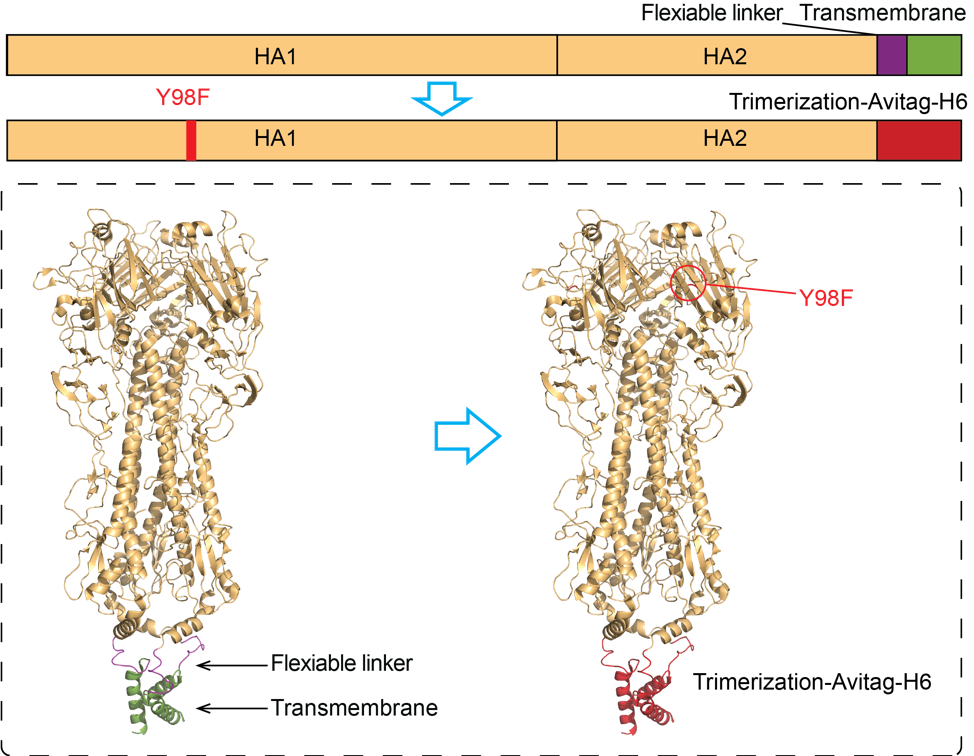
Antigen probe
Users are allowed to generate antigen probes for given HA sequences with one-click. Click Tools-> Antigen Probe in menu. For given sequences, Librator generates “Y98F” mutation (H3 numbering) and replace flexible linker and transmembrane region with Trimerization-Avitag-H6 sequence.This function is not available for most H16, all H17 and H18 because those subtypes have already developed natural mutation “Y98F”.
-
Compare sequences and generate screening mutations
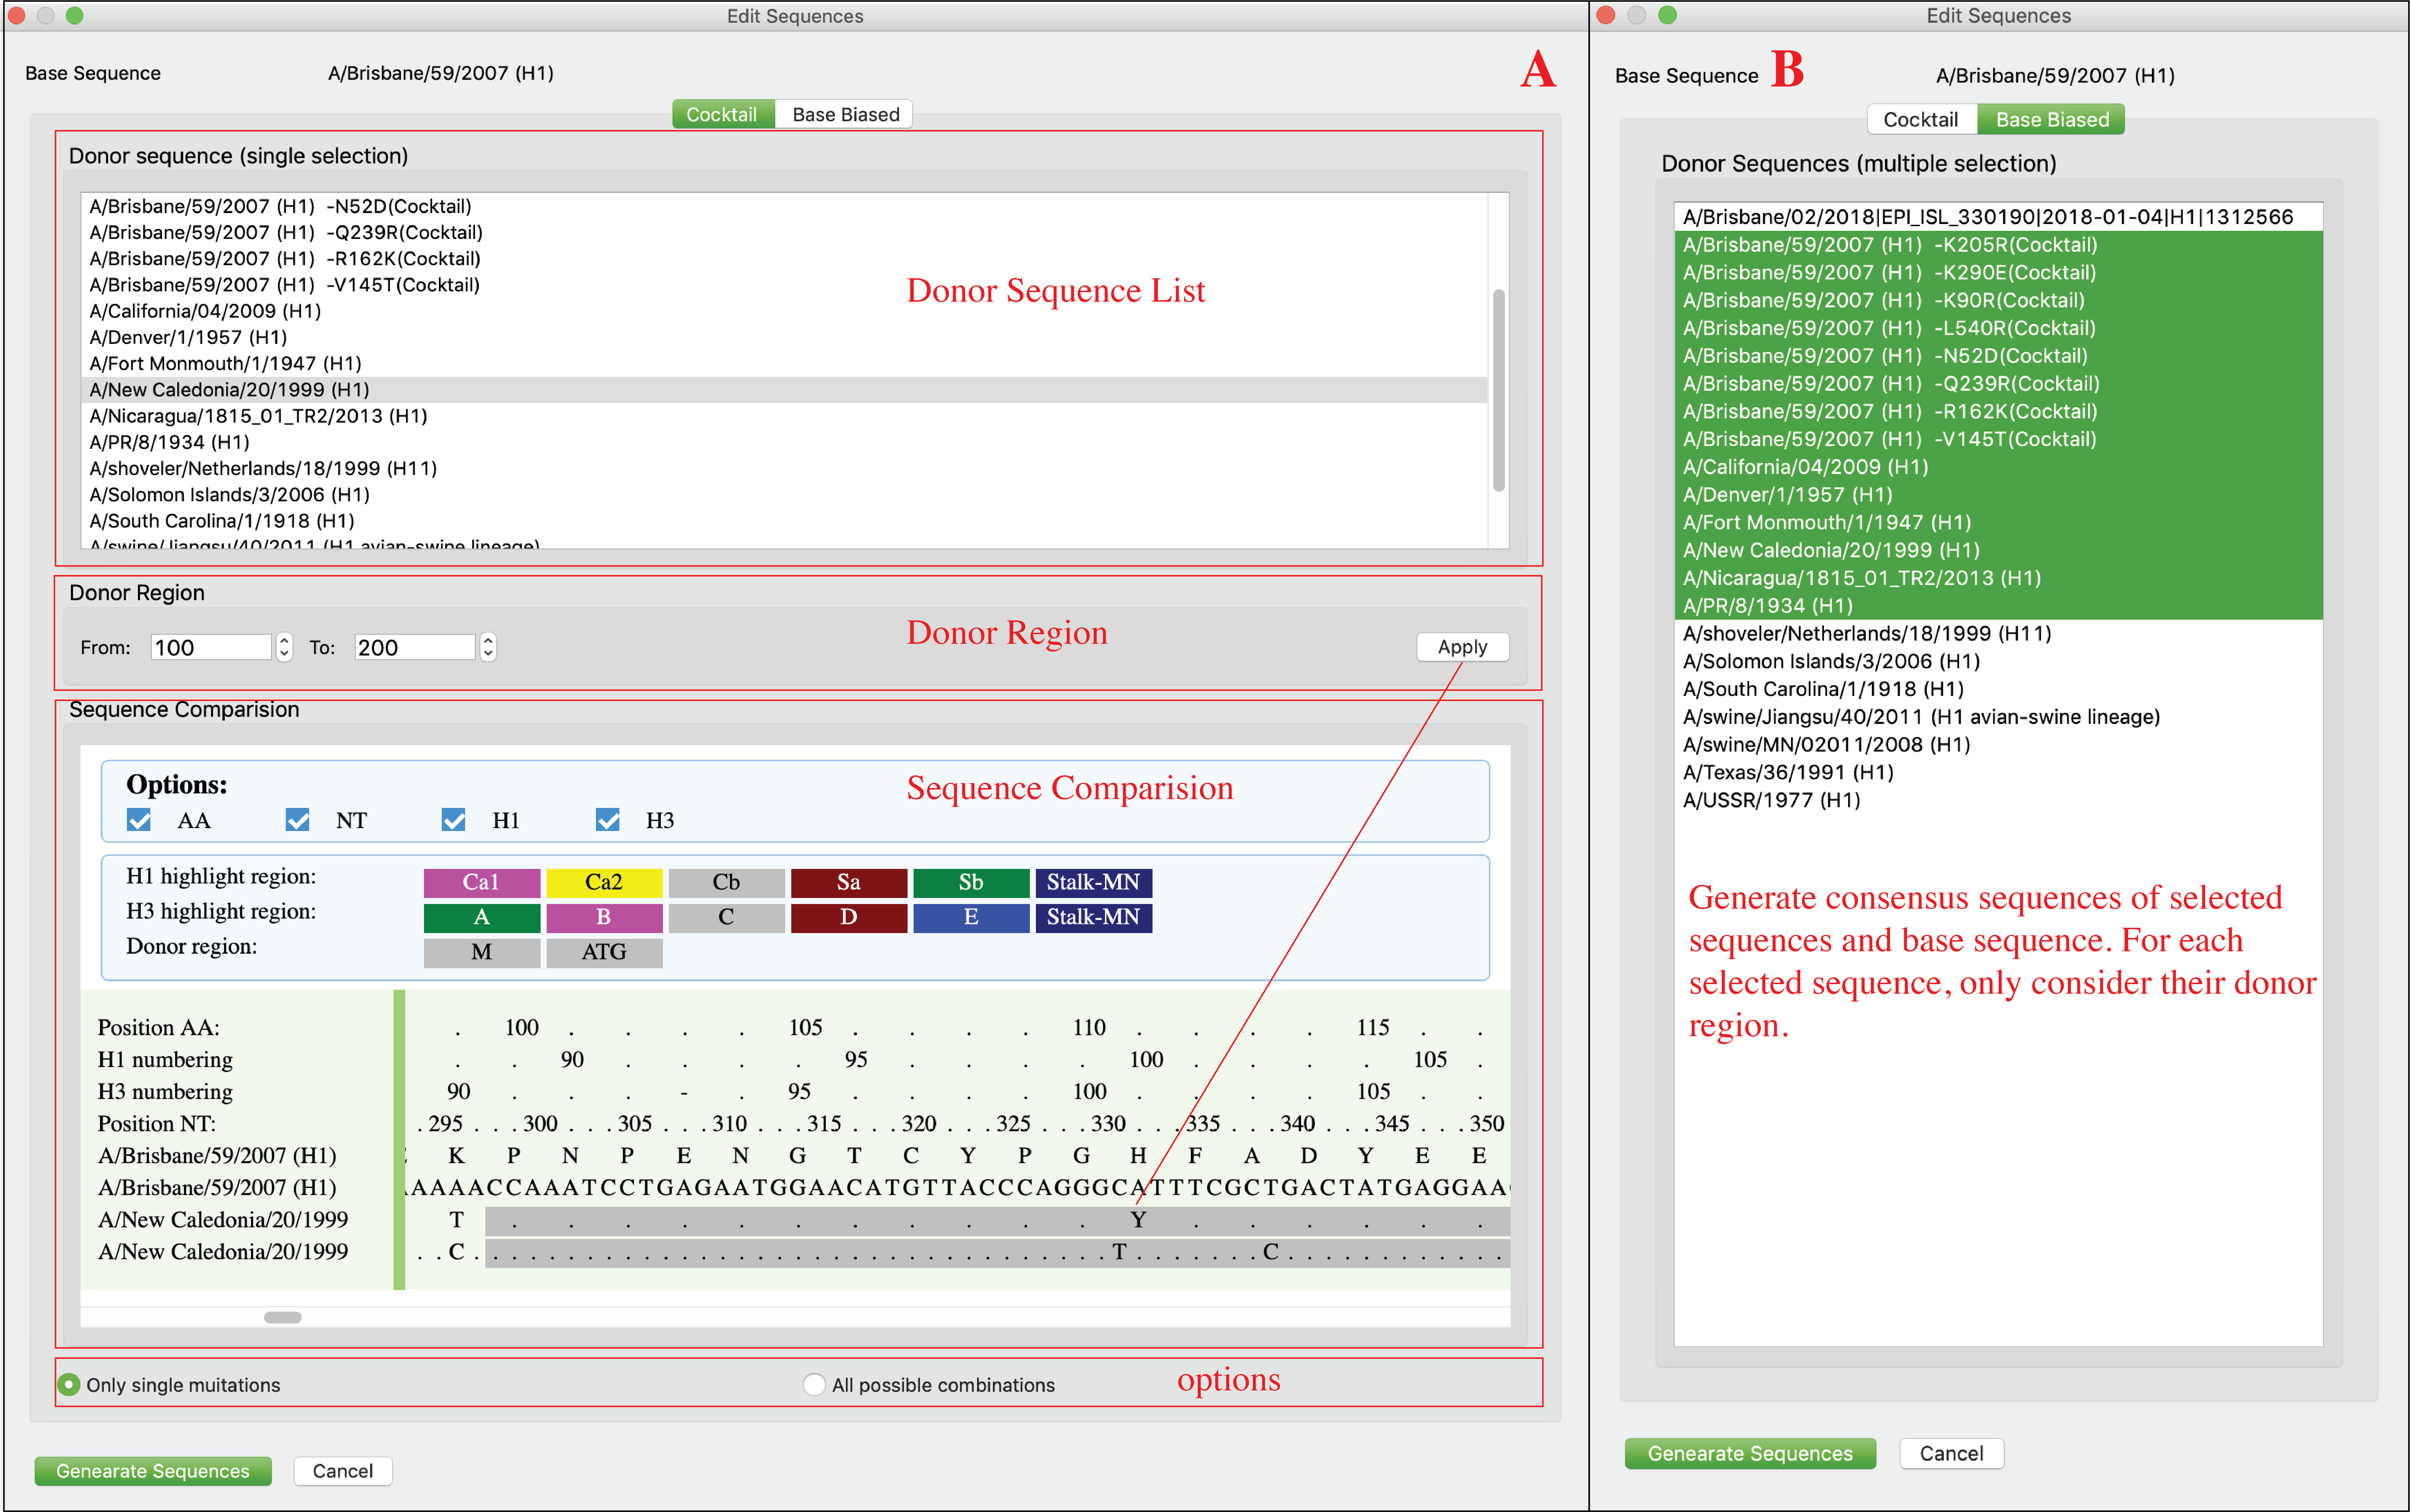
Users can compare sequences and generate consensus sequences (Base biased) or new sequences with screening mutations (Cocktail). Click Edit Sequence-> Editing in menu. Cocktail mode (A): Compare base sequence to another sequence, identify all mutations between two sequences on donor region of donor sequence (user can setup donor region on this interface), then generate new sequences with those mutations using base sequence as template. Users can choose to only generate sequences with single mutations or all combinations of mutations. Base biased mode (B): Generate consensus sequences of base sequence and selected sequences. For each donor sequence, only their donor region will be considered (full sequence will be considered when donor region is none).
-
Epitope transplant across different subtypes
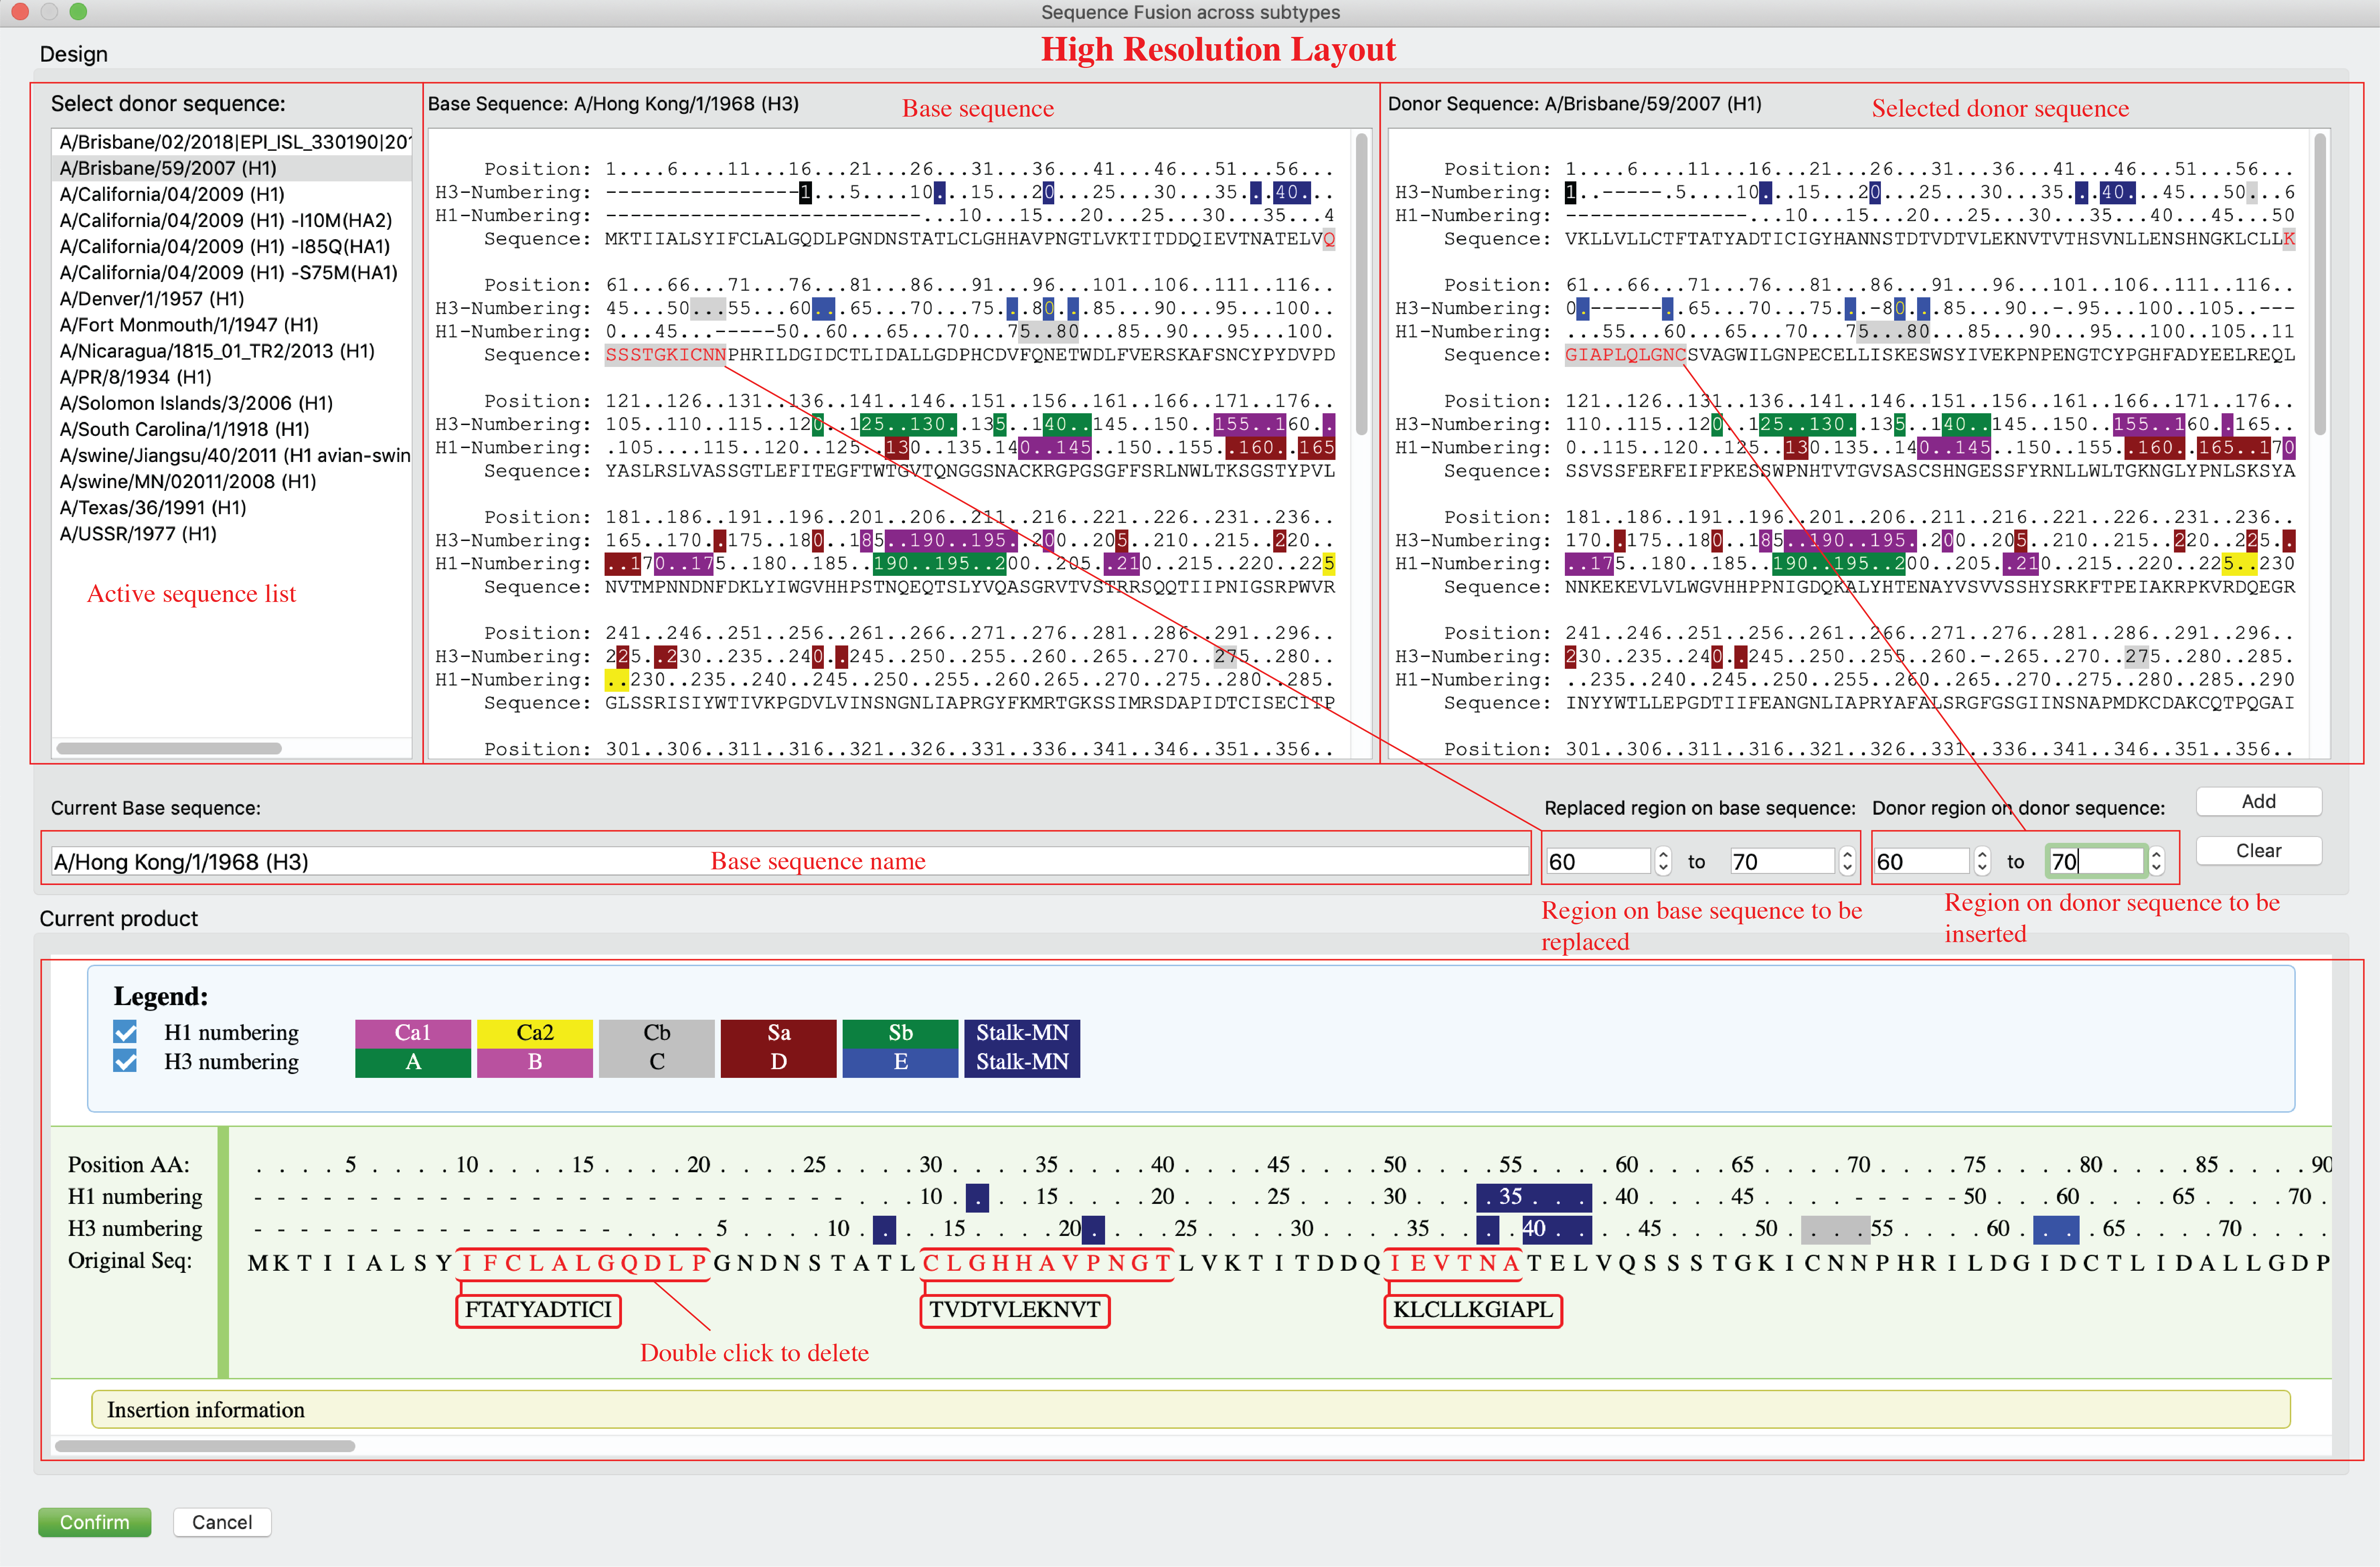
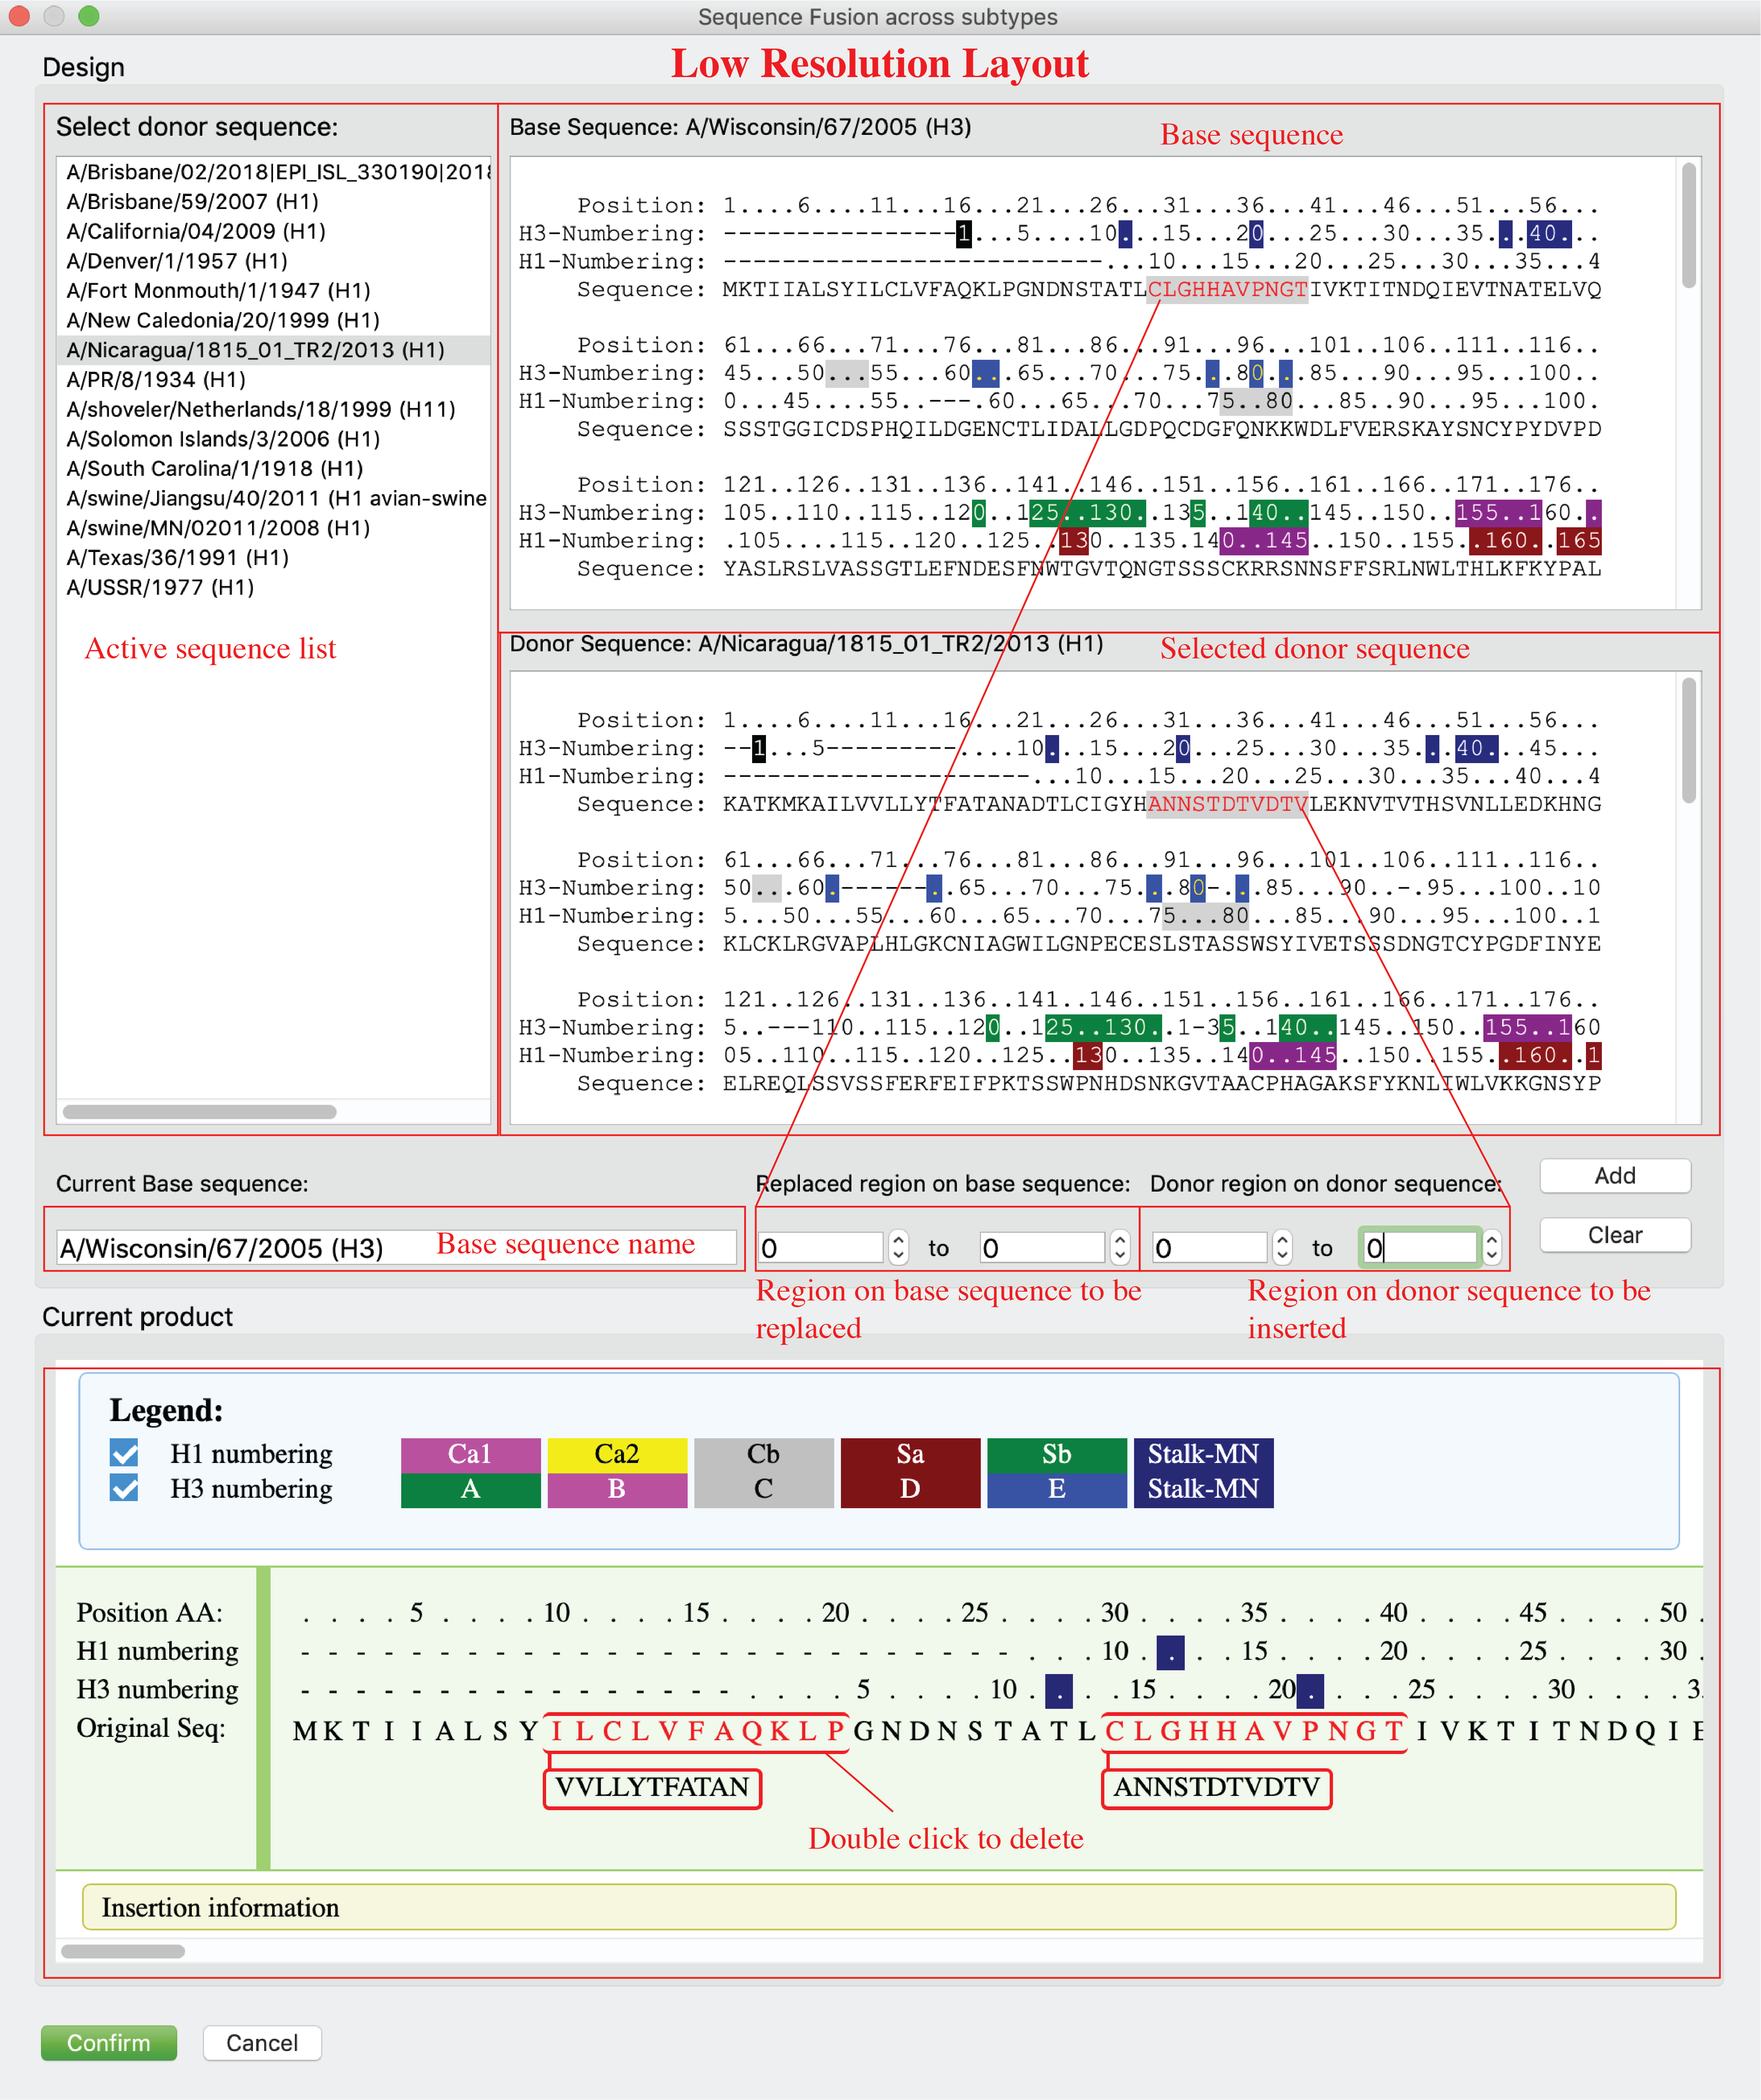
Users can transplant epitopes/regions from sequences of different subtypes. Regions being removed from base sequence and that being inserted from donor sequence are not necessary to have same length. Users can add multiple replacements on one sequence (click ‘Add’). Those replacements could be from different sequences. Users can review the replacement design in the bottom window. Users can double click replacement to delete it. Users also can click ‘Clear’ button to rest current design. Click Edit Sequence-> Fusion in menu. This window has two layouts: high resolution layout and low resolution layout. Liberator will automatically choose the best fit based on current display resolution. Users also can click Edit Sequence-> Fusion (high resolution) or Edit Sequence-> Fusion (low resolution) to determine the layouts they prefer (As shown below).
3) Gibson Clone Fragments Design
-
Generate Gibson Clone fragments
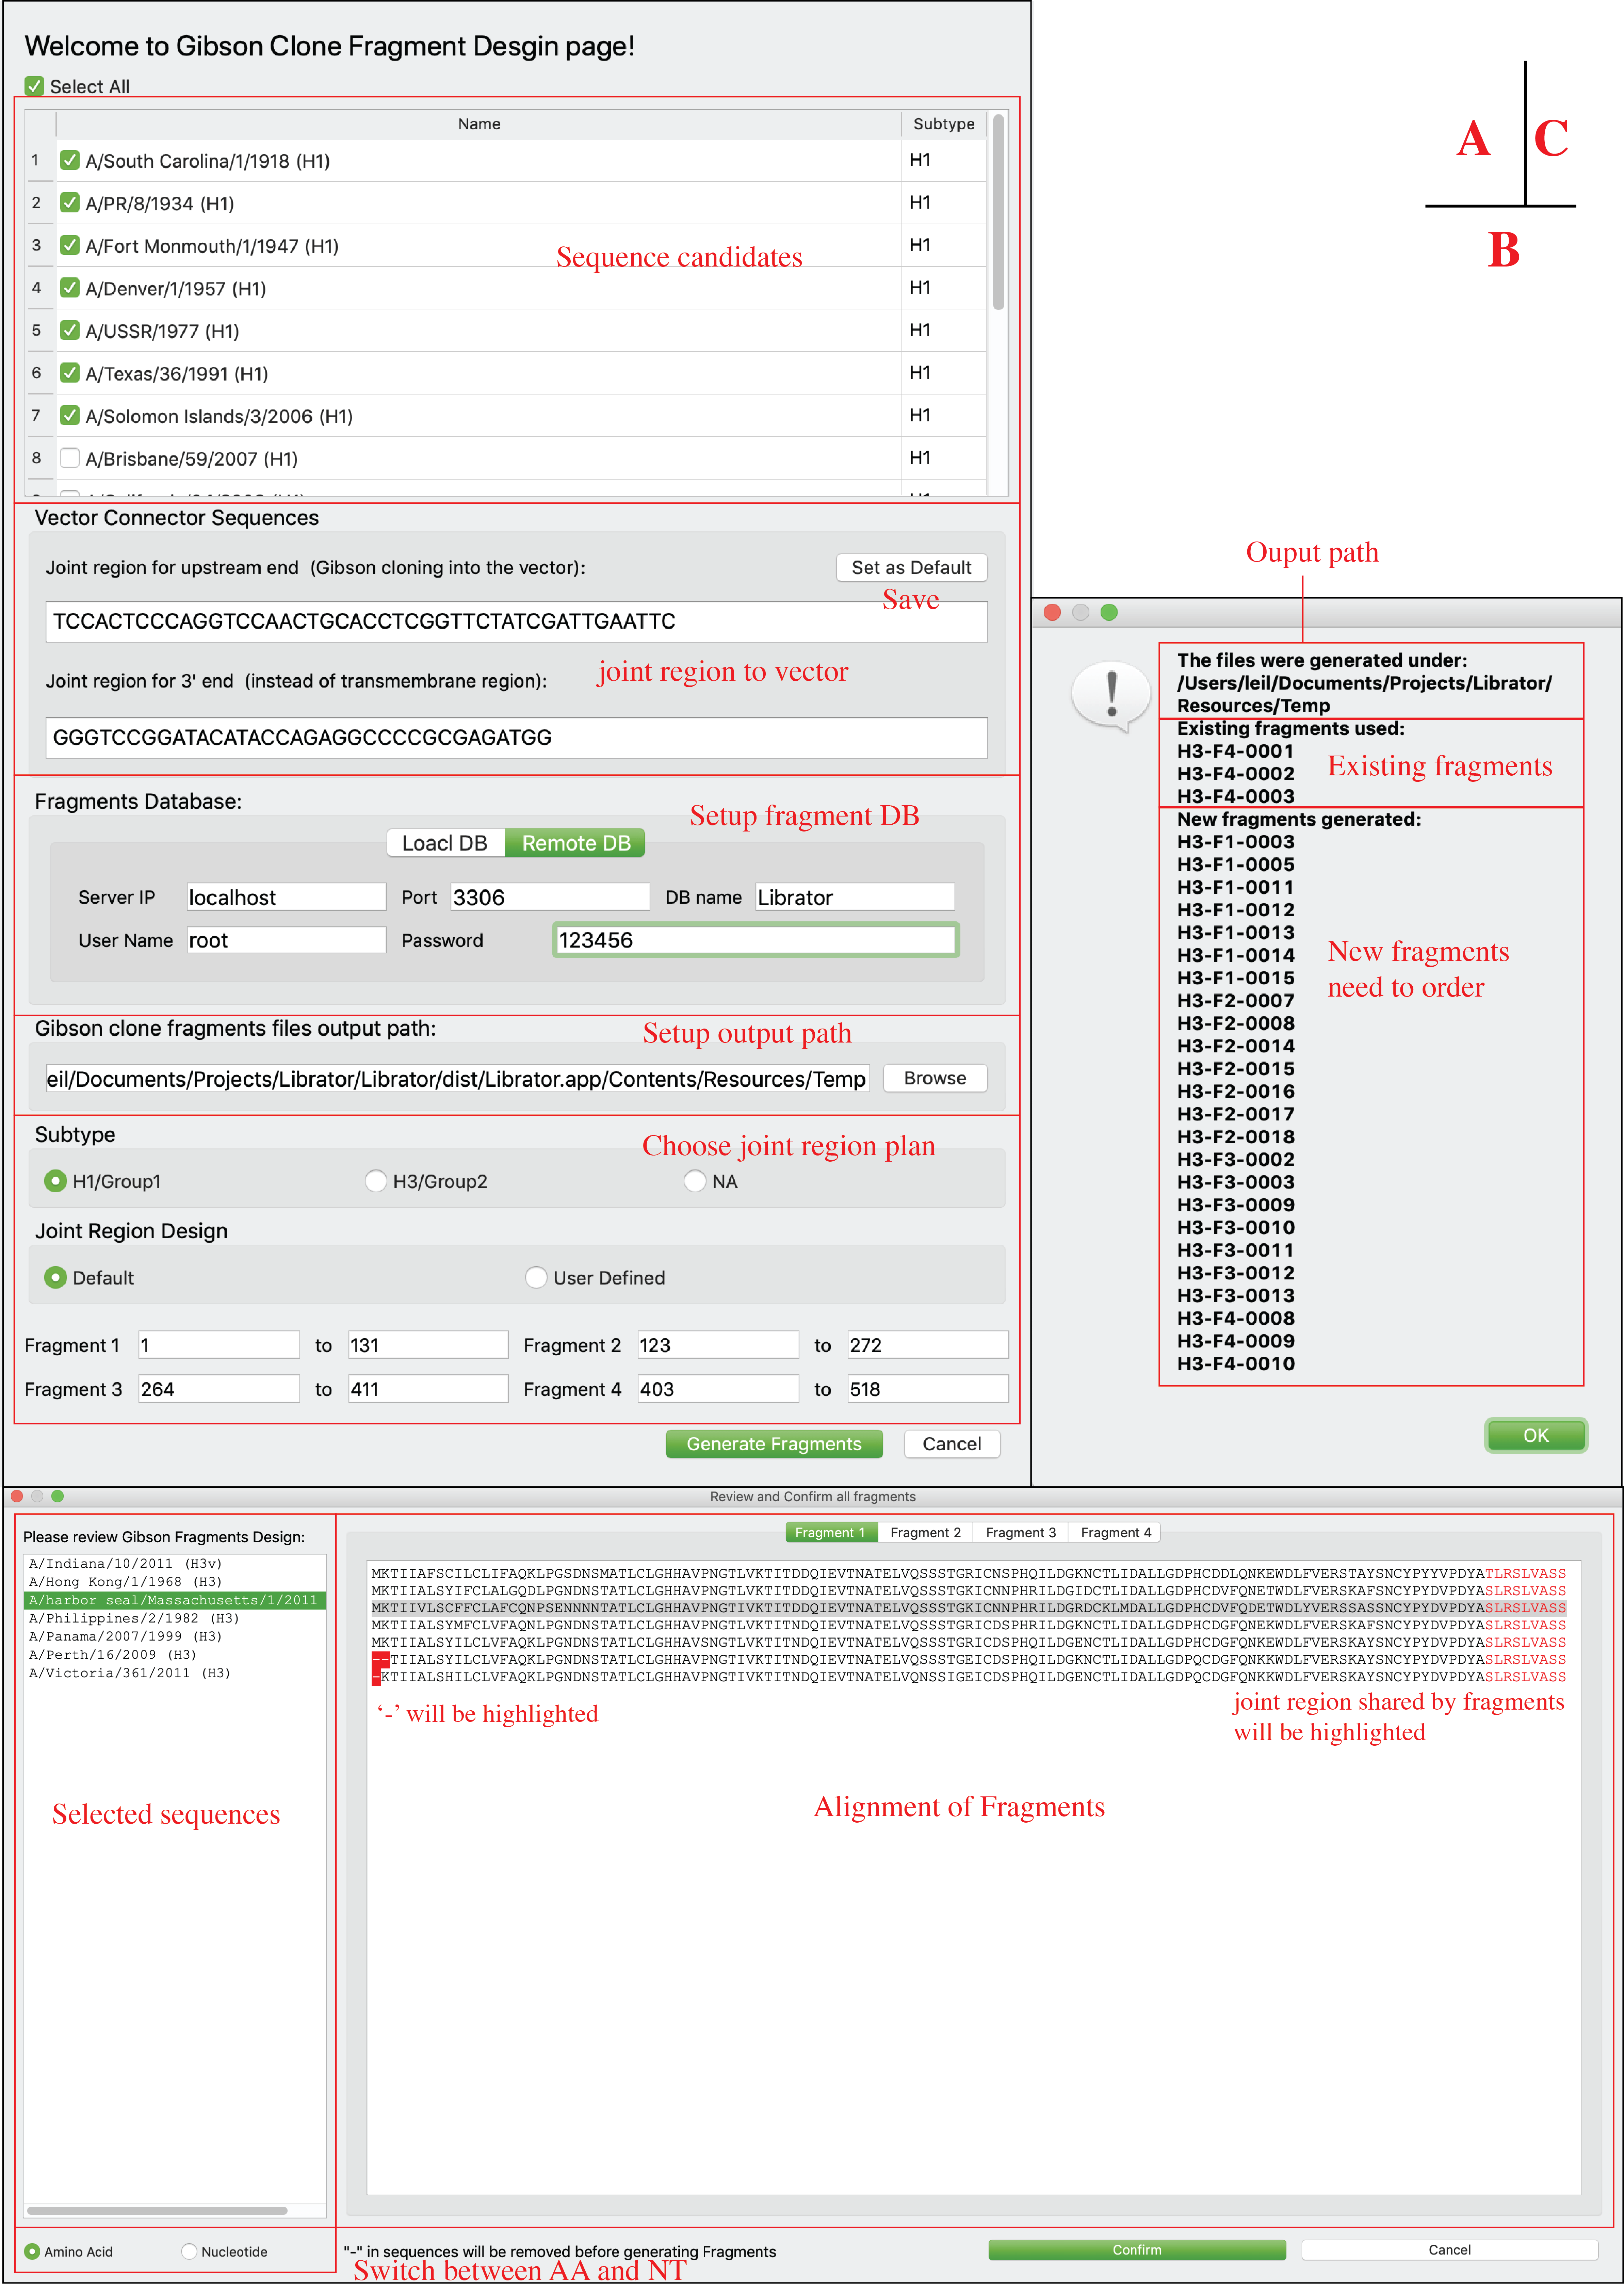
Users can generate Gibson Clone Fragments. Users can select sequences, determine fragment DB, output path, and joint region plan (panel A), after click “Generate Fragments” button, a dialog will pop up for users to review and confirm (panel B). On panel B, users can review the generated Fragments (both amino acid sequences and nucleotide sequences), joint regions that shared by neighbor fragments are highlighted. Joint region that connect fragment 1 and 4 to the vector not displayed for AA sequences but can be found in NT sequences. ‘-’ in AA alignments indicate incomplete sequences or deletions and will be deleted in NT fragments. Users can click “confirm” button to generate fragments after they confirmed current fragments. After a few second, a notice will be popped up with summarized results (panel C).
-
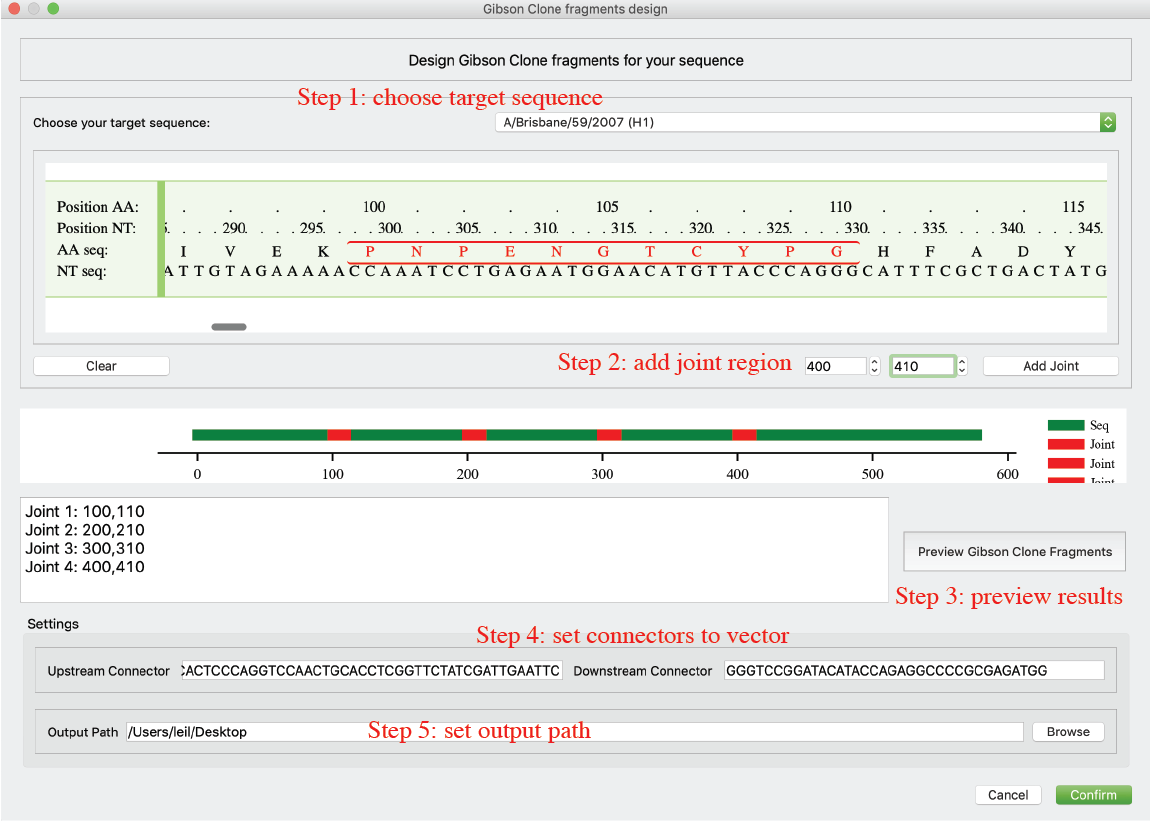
Generate Gibson Clone fragments for any sequence
Beside HA/NA sequences, Librator also allows users to split any of their sequences into fragments. Users can use this function for some frontier and novel research, e.g. COVID-19. Users can click GibsonClone-> GibsonClone for single sequence in menu. Users can view their sequence and add at most 12 joint regions (where to split the sequence) to their sequence. Then users can preview the fragment products under current design. After that, users can setup upstream connector sequence and downstream connector sequence and output path.